
In this article, we will take one step further and explore another key concept in financial trading known as convergence and divergence. We will shed light on two widely used key indicators, RSI (Relative Strength Index) and MACD (Moving Average Convergence Divergence), to better elucidate how it works in conjunction with price movements of any financial instrument.
Before we jump into defining convergence and divergence., it is vital to understand that RSI and MACD are momentum indicators i.e. they determine the strength or weakness in the price of an underlying pair/instrument thus giving an indication of a possible trend continuation or a trend reversal.
IMPORTANT: This mini series of forex trading blogs are not considered advice on how you should trade, but merely is providing a tool you can use to compliment your existing fx trading strategy.
What is RSI (Relative Strength Index)?
*Mathematical derivation of RSI is excluded for simplicity and emphasis is on the conceptual interpretation.
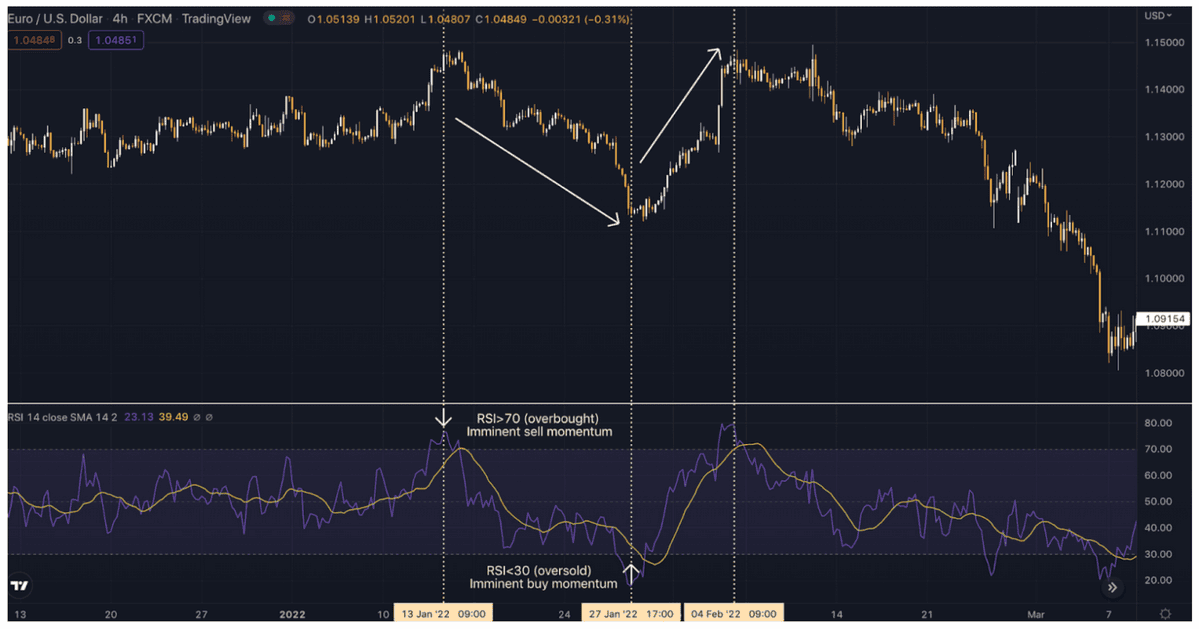
Relative Strength Index is a momentum indicator that helps in identifying whether the market for any particular pair/instrument is overbought or oversold.
An Overbought condition implies the exhaustion of buying pressure thus indicating an imminent sell momentum. Conversely, an oversold condition implies the exhaustion of selling pressure thus indicating an imminent buy momentum. RSI is a line graph with a reading from 0 to 100. Normally, a reading of 70 or above indicates an overbought range whereas a reading of 30 or below indicates an oversold range. A graphical representation of RSI along with the price movement is demonstrated below.
What is MACD (Moving Average Convergence Divergence)?
*Mathematical derivation of MACD is excluded for simplicity and emphasis is on the conceptual interpretation.
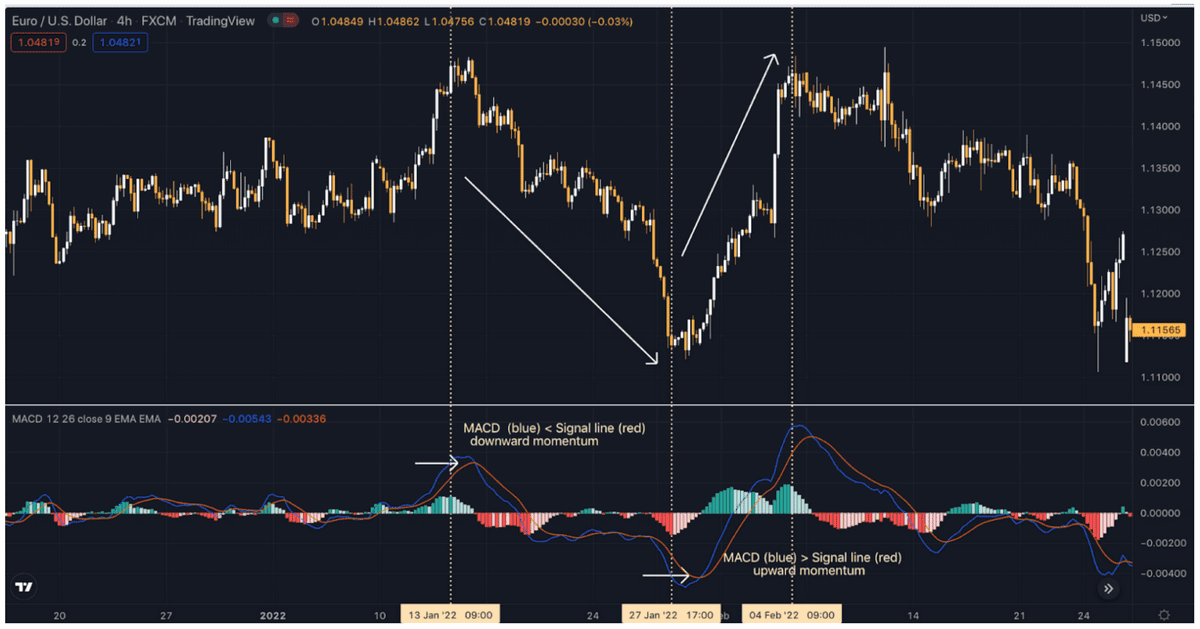
Moving average convergence divergence (MACD) calculates the difference between the 26-period exponential moving average (EMA) and the 12-period EMA. The resulting outcome gives us the MACD line.
Next, a nine-day EMA is taken of the MACD line which is known as the signal line. This signal line then acts as a key factor in deciding the momentum.
If MACD line > Signal line (crosses above the signal line), it indicates a buy momentum. Conversely, when MACD line < Signal line (crosses below the signal line), it indicates a sell momentum. For further clarity, a graphical representation of MACD along with the price movement is demonstrated below.
Now that we have briefly looked through how RSI and MACD can help in identifying a potential price movement, let us move to defining convergence and divergence.
What is convergence?
When the price of any pair/financial instrument and its indicator (there are numerous indicators, however our focus in this blog is on RSI and MACD) are following the same direction.
What is divergence?
When the price of a financial instrument and its indicator are moving in opposite directions. In other words, the two trends (price and indicator) are moving further away from each other.
This in turn implies that convergences are a signal of trend continuation while divergences are a signal of trend reversal. Hereafter, we will place our focus on how to identify and trade divergences.
How do I identify divergences?
- Positive divergences: Price makes a higher high, Indicator makes a lower high.
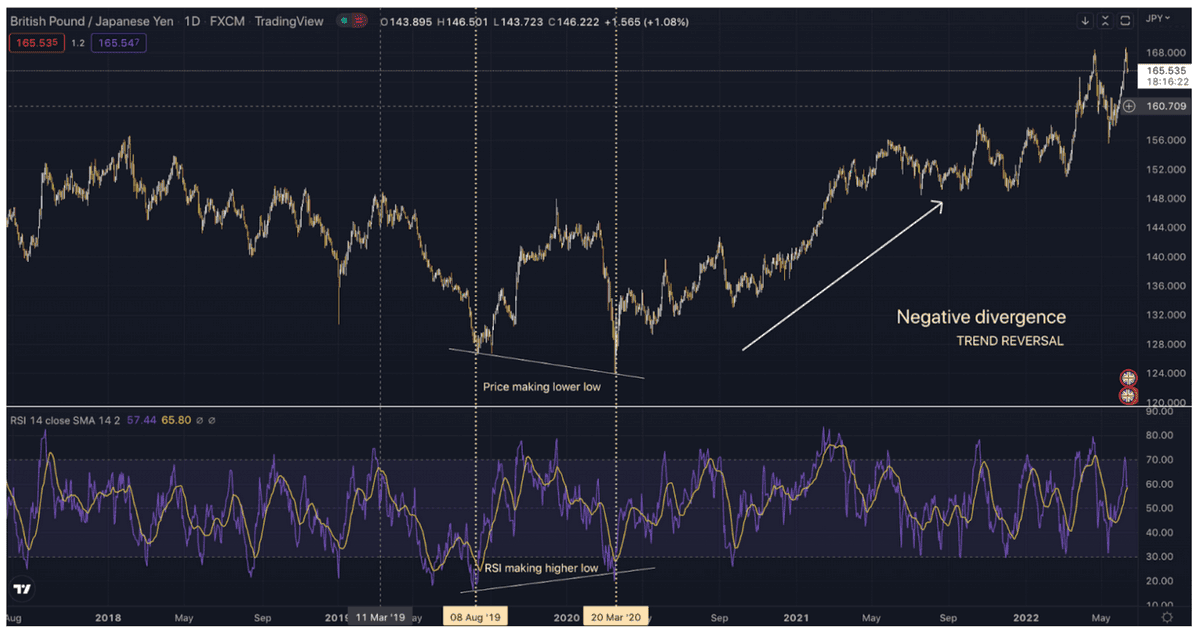
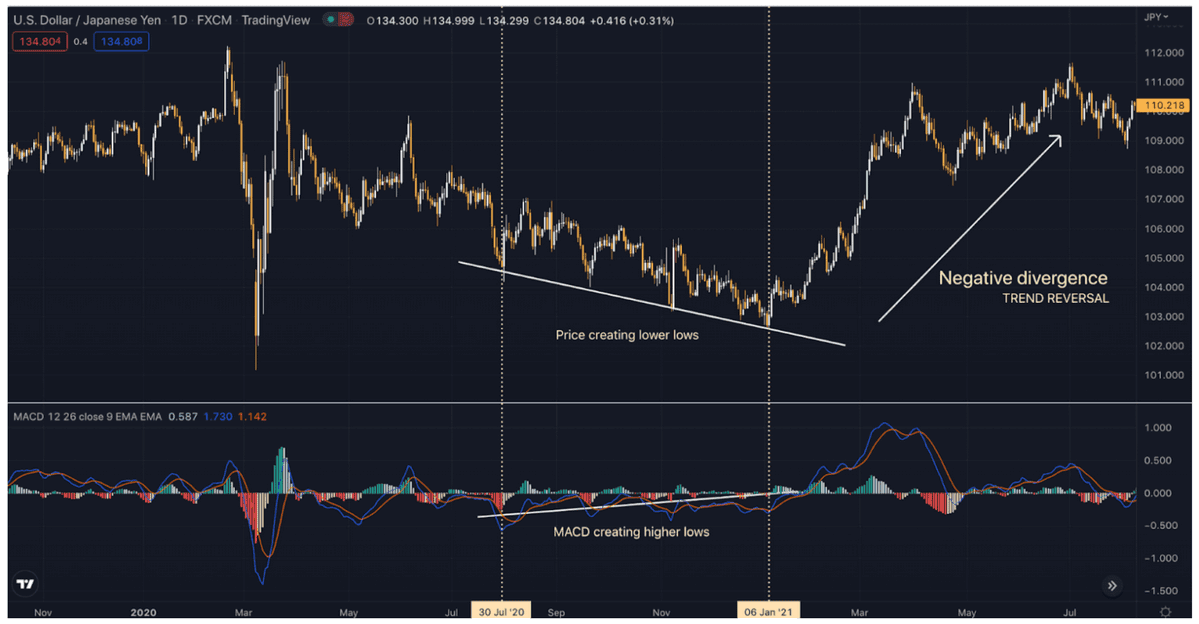
- Negative divergences: Price makes a lower low and indicator makes a higher low.
Let us now combine everything together and examine how it works in conjunction with price
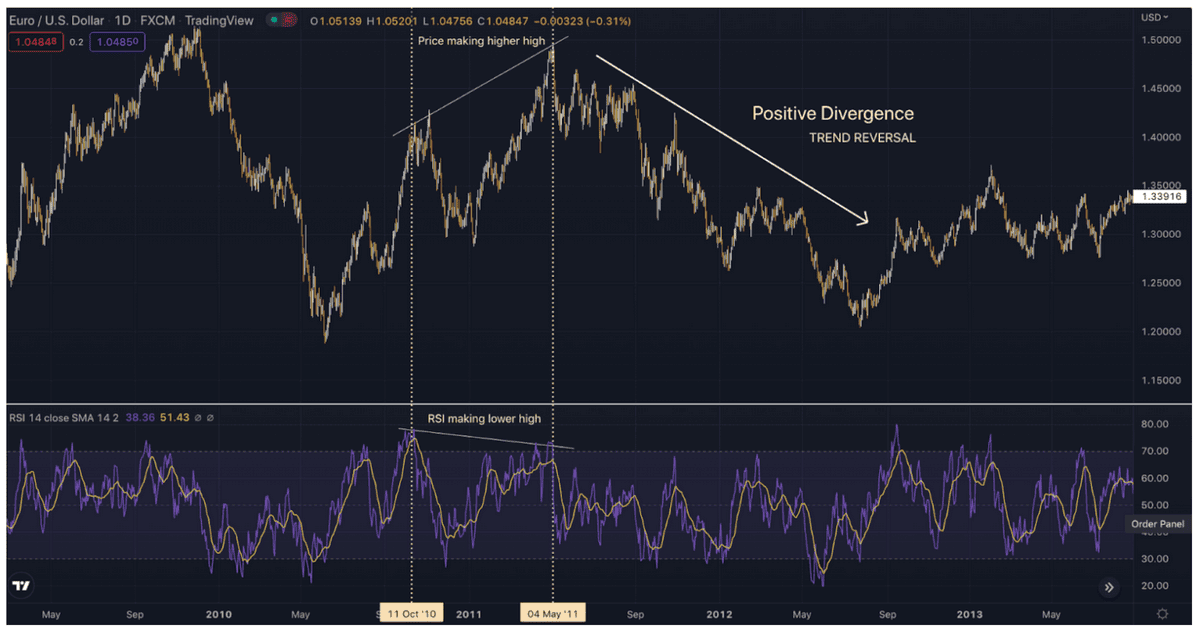
movements of any financial instrument for a better understanding. Positive divergence with respect to RSI: (Sell opportunity)
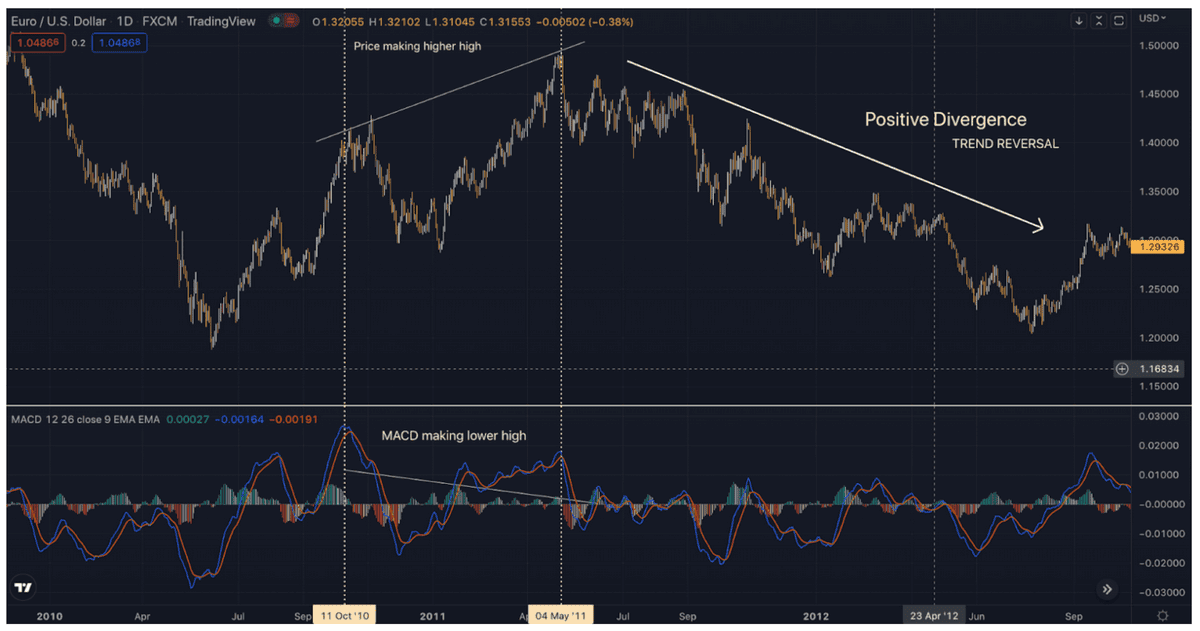
As it can be seen from the above chart of EURUSD, the price made higher highs. However, RSI was showing exhaustion in the momentum and made lower highs. The two trends (Price and Indicator) are moving farther away from each other thus creating a divergence which in turn resulted in a trend reversal. The same follows for MACD in the graph below.
Positive divergence with respect to MACD: ( Sell opportunity)
Negative divergence with respect to RSI: (Buy opportunity)
Negative divergence with respect to MACD: (Buy opportunity)
Needless to say, these are just concepts graphically explained for your understanding. However, when you are trading at any forex prop firm or trading a live funded account, you should always practice good risk management. Have a stop loss, control your lot size and use what you feel comfortable trading.
Trading divergences is one of the most effective ways of trading and you are more likely to capture big price movements given you identify them correctly and patiently wait for the right setup to form based on your strategy.


