

Triangle patterns come in three main variations and are a common sight in the forex market. These patterns provide traders with valuable insights into potential future price movements and the likelihood of the current trend continuing. However, understanding the nuances of each triangle pattern is crucial, as they cannot all be interpreted in the same way.
Key Points about Forex Triangle Patterns:
- Definition of a triangle pattern
- Overview of symmetrical triangles
- Explanation of ascending and descending triangle patterns
- Key considerations when trading triangle patterns
Test your knowledge of forex patterns with our interactive Forex Trading Patterns blog.
What is a Triangle Pattern?
A forex triangle pattern is a consolidation formation that appears mid-trend, often signaling the continuation of the prevailing trend. This pattern is identified by drawing two converging trendlines as price moves sideways temporarily. Traders typically watch for a breakout in the direction of the prior trend as a cue to enter the market.
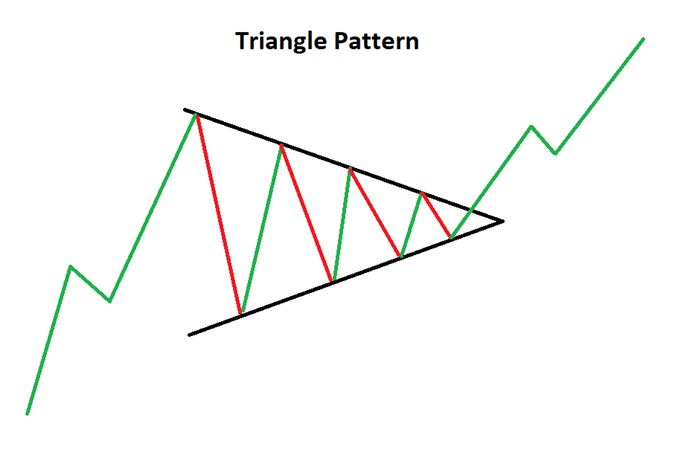
This article utilizes line chart illustrations to highlight the three triangle patterns. While traders are encouraged to explore different technical analysis tools, most prefer using forex candlestick charts for added clarity.
Symmetrical Triangles
The symmetrical triangle is often considered the foundation for all triangle pattern variations. As its name suggests, this pattern forms when two trendlines converge symmetrically on a chart.
What sets the symmetrical triangle apart from other patterns is its neutrality. While the pattern itself does not favor a specific direction, traders generally anticipate a breakout aligned with the existing trend.
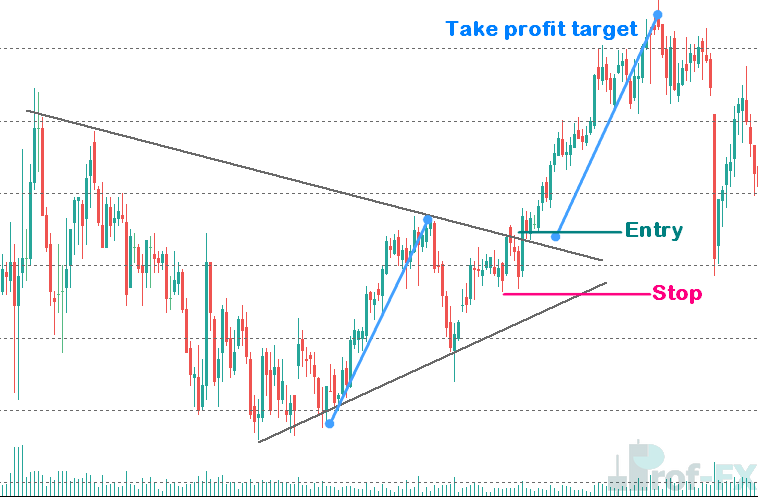
Symmetrical Triangle Trading Strategy
Symmetrical triangles offer a practical way to measure and predict breakout targets, and this method can be adapted for other triangle variations.
In the AUD/USD chart below, the symmetrical triangle is evident. The vertical distance between the upper and lower trendlines can be measured and applied to forecast the target price after a breakout.
It’s important to note that perfectly symmetrical triangles are rare. Traders should focus less on perfection and more on understanding the market’s message through price action.
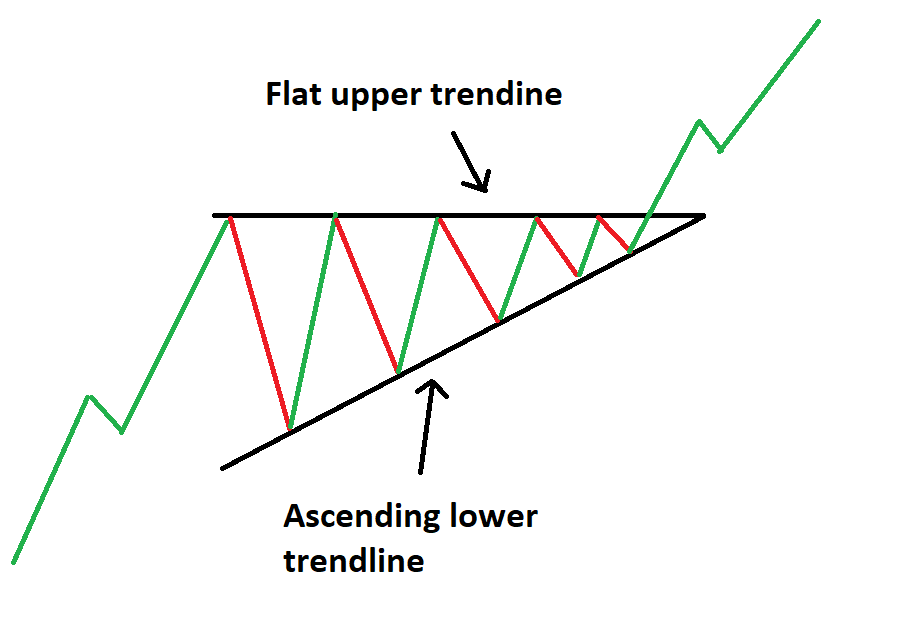
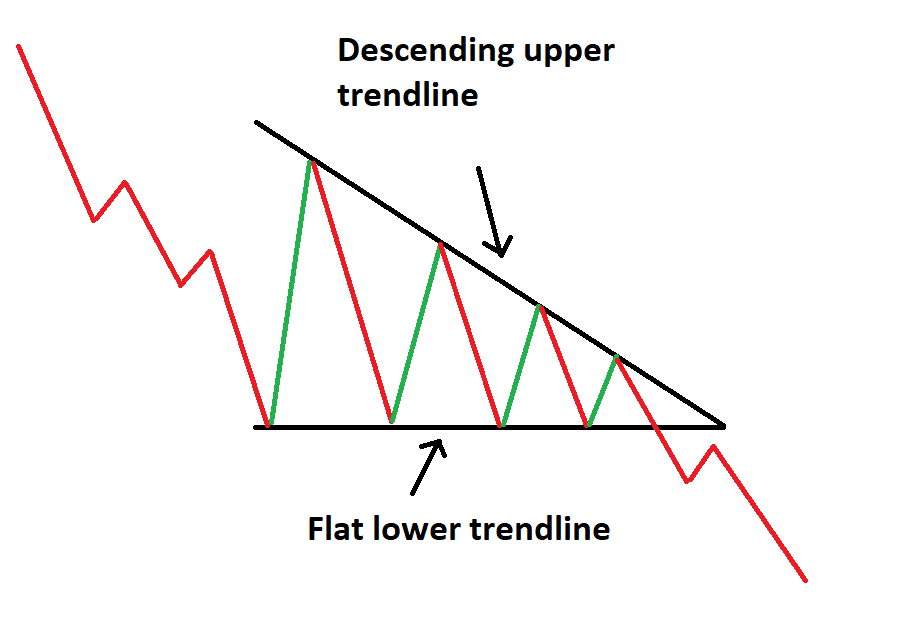
Ascending Triangle Pattern
The ascending triangle is similar to the symmetrical triangle, but its upper trendline is flat while the lower trendline rises. This pattern indicates stronger buying pressure as prices form higher lows. With repeated attempts to breach the flat upper trendline, an upside breakout becomes increasingly likely.
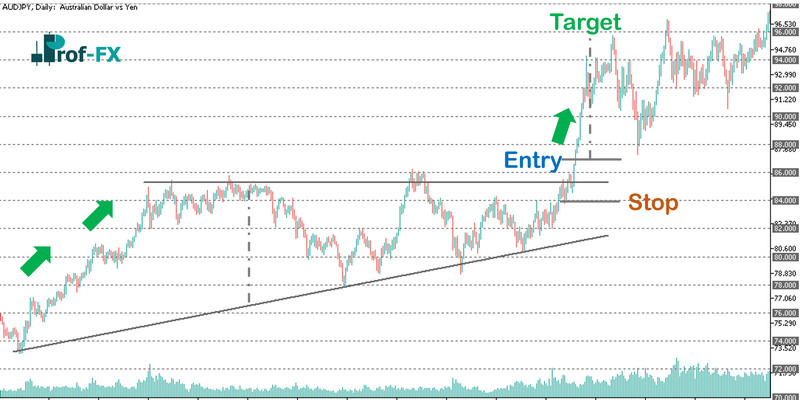
Ascending Triangle Trading Strategy
The ascending triangle pattern is shown in the AUDJPY chart below. Following an uptrend, a consolidation period creates the ascending triangle. By measuring the vertical distance at the pattern’s start, traders can estimate the profit target at the breakout. A tight stop-loss can be placed at the most recent swing low to minimize risk.
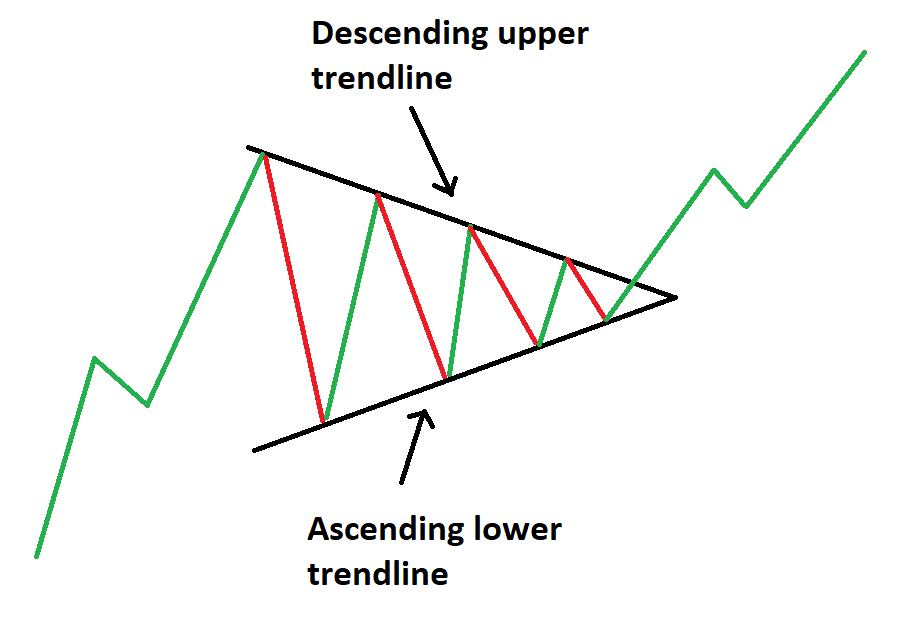
Descending Triangle Pattern
The descending triangle, in contrast, features a flat lower trendline and a descending upper trendline. This pattern reflects stronger selling pressure as prices create lower highs.
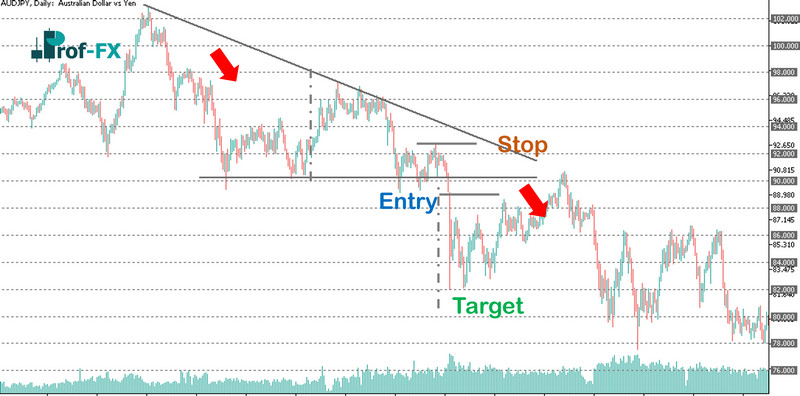
Descending Triangle Trading Strategy
A classic descending triangle pattern is evident in the AUD/JPY chart below. A downtrend leads to a consolidation phase where sellers overpower buyers, pushing prices lower. A decisive break of the lower trendline provides an opportunity to short the market. Setting an appropriate stop-loss is critical to managing risk, as reversals can occur quickly.
The profit target is calculated using the vertical distance measured at the beginning of the descending triangle.
Trading with Triangle Patterns: Key Takeaways
- Always assess the trend’s direction before the consolidation phase.
- Use upper and lower trendlines to identify the type of triangle pattern forming.
- Apply the measuring technique to set realistic target levels.
- Follow robust risk management strategies to minimize false breakout risks and maintain a favorable risk-to-reward ratio.
Further Reading on Forex Trading Patterns
Other notable continuation patterns include the rising wedge, falling wedge, and pennant patterns.
Reversal patterns, by contrast, signal potential market reversals. Popular examples include the Head and Shoulders, Morning Star, and Evening Star patterns.
For those new to trading, understanding the fundamentals is essential. Explore our free New to Forex trading guide to kickstart your journey.


