 |
 |
 |
 |
What Is the Precision Trend Histogram Indicator
The Precision Trend Histogram Indicator for MT4 is a powerful trend-following tool designed to help traders identify bullish and bearish momentum with high accuracy. Unlike basic moving averages or lagging oscillators, this indicator focuses on price precision — filtering out market noise and revealing clear directional changes.
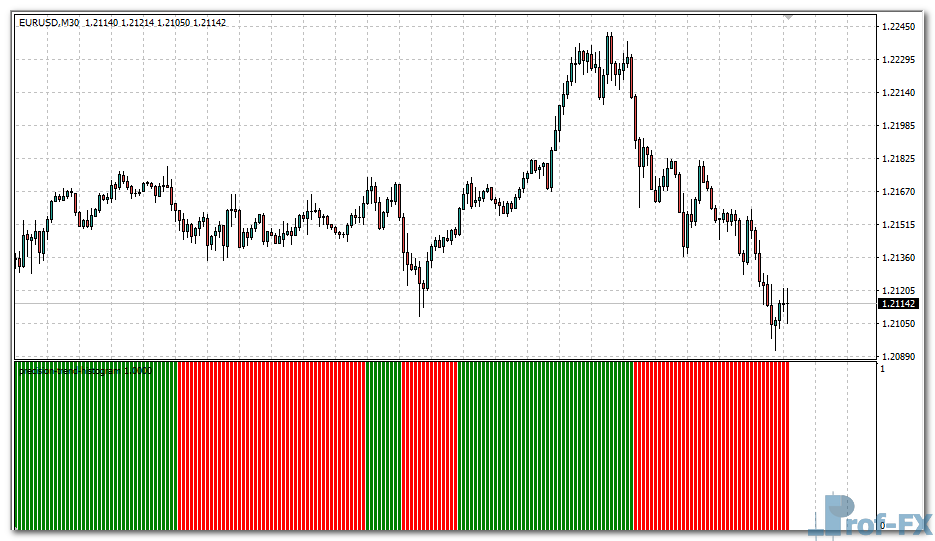
Displayed as a histogram in a separate window, the Precision Trend Histogram Indicator paints green bars for bullish phases and red bars for bearish phases. This color-coded simplicity makes it easy for traders to spot trend reversals at a glance, whether on short-term scalping setups or long-term swing trades.
For beginners, the indicator serves as a visual guide to understanding how trends form and shift in real-time. For experienced traders, it offers refined timing cues that enhance entries and exits across various trading strategies.
If you are searching for the best custom indicators for MT4 that can simplify your trend detection, Precision Trend Histogram deserves a place in your toolbox.
See also: Previous Highs and Lows
How It Works — Precision Trend Histogram Logic
The Precision Trend Histogram Indicator works by calculating the relationship between the high, low, and close prices within a specified averaging period. It compares recent volatility ranges and applies a sensitivity filter to smooth out irregular market movements.
Here’s how it behaves in practice:
- When the market closes above a certain threshold (defined by the sensitivity and average range), the indicator signals a bullish trend by plotting a green histogram bar.
- When the market closes below that same threshold, it marks a bearish trend with a red histogram bar.
- When no clear direction is detected, the indicator stays neutral — providing a period of rest before the next trend begins.
The logic behind it ensures that the indicator reacts only to meaningful price movements while ignoring temporary spikes. This results in fewer false signals compared to traditional oscillators like MACD or RSI.
Because the Precision Trend Histogram Indicator for MT4 adapts dynamically to volatility, it works well across different market conditions — from trending environments to consolidating phases. Traders can also combine it with price action or support and resistance analysis to confirm signals and strengthen decision-making.
In short, the indicator translates raw market data into clear visual insights — helping you understand where the market wants to go next.
Precision Trend Histogram Indicator Settings
The Precision Trend Histogram Indicator includes two adjustable parameters that let you customize its responsiveness and accuracy according to your trading style:
Average Period (avgPeriod)
- Defines the number of bars used to calculate the average range.
- Smaller values (e.g., 10–20) make the indicator more sensitive — ideal for scalping or intraday trading.
- Larger values (e.g., 50–100) smooth out the signals — better for swing or position traders who prefer more stability.
Sensitivity
- Controls how reactive the indicator is to price changes.
- Increasing the sensitivity makes it detect minor market shifts faster, while lowering it filters out noise for cleaner signals.
- A good starting point is the default setting of 3, which balances smoothness and responsiveness.
Together, these two settings help traders fine-tune how quickly or slowly the indicator identifies new trend formations. For example, combining higher sensitivity with a shorter average period gives faster trend reversals — suitable for high-volatility pairs like GBP/JPY.
Because of its flexibility, you can easily integrate the Precision Trend Histogram Indicator into any forex trading strategy — whether it’s trend-following, breakout trading, or momentum-based systems.
Practical Tips for Using the Precision Trend Histogram Indicator
- Combine with price action: Confirm bullish signals with higher highs and bearish signals with lower lows.
- Use multiple timeframes: Check trend confirmation across H1, H4, and Daily charts to avoid false entries.
- Apply smart money management: Even accurate indicators can fail in volatile markets, so protect your trades with stop-loss levels.
- Avoid overtrading: Wait for clear color transitions from red to green (or vice versa) to confirm the momentum shift.
If you are learning how to use indicators in forex trading, this tool offers a clean and visual way to grasp the concept of market direction. It’s also a good entry point for anyone studying forex education for beginners and technical indicators for forex strategies.
Why You Should Try It
The Precision Trend Histogram Indicator for MT4 is not just another colored histogram. It is a refined technical tool that measures market conviction rather than just price movement. Traders who prefer precision and minimal lag will find it particularly effective for identifying trend reversals early.
By focusing on accuracy and simplicity, it helps you improve your trading consistency and avoid emotional decisions. You can use it as a standalone confirmation filter or as part of a broader system combining other technical analysis tools in forex.
If your goal is improving forex trading results with indicators, this one gives you a reliable edge without cluttering your chart.
How to Instal “Precision Trend Histogram” Indicator for Metatrader 4
- Open your Metatrader 4 platform.
- Download and save the “Precision Trend Histogram” indicator to your desktop or any other folder located on your local computer.
- Choose “File” then “Open Data Folder” (Ctrl + Shift + D) on your Metatrader 4 platform.
- Explore the following folder: MQL4 > Indicators.
- Copy and paste the “Precision Trend Histogram” indicator into this folder.
- Restart Metatrader 4.
- “Precision Trend Histogram” indicators are stored by default in the custom indicator folder.
- To access these indicators, go to Top Menu > Insert > Indicators > Custom.
- In order to add a “Precision Trend Histogram” indicator to any of your Metatrader 4 charts, you will need to select a forex chart with one mouse click, then go to Top Menu > Insert > Indicators > Custom > click the “Precision Trend Histogram”.
- Done!
See a complete guide How To Install Metatrader 4 Custom Indicators
Final Thoughts
The Precision Trend Histogram Indicator for MT4 stands out among free forex indicators for beginners because of its clarity, flexibility, and ease of use. It gives traders a straightforward way to identify momentum shifts and make informed trading decisions.
You can experiment with different settings to match your preferred trading timeframe or pair, and even combine it with other forex MT4 indicators for enhanced signal confirmation.
You can try this tool directly by downloading it below and experience how precision can redefine your trend trading strategy.
Free Download Precision Trend Histogram indicator for Metatrader 4
- precision-trend-histogram.zip
- Size: 18.2 kb
- Platform: MT4 | Format: .mql4/.ex4 | File: dir9mt4 | Request Remove!


