
Trading without clearly defined support and resistance levels is much like driving a car without a seatbelt. The risk is always present, even if the road looks calm. In forex markets, strong downtrends can suddenly stall, and powerful uptrends can reverse sharply when price encounters a significant barrier. Without understanding where these critical levels exist, traders risk allowing profitable positions to turn into unnecessary losses.
Support and resistance levels act as decision-making zones where market participants reassess value. These areas often determine whether price continues its direction or changes course. Among the most widely used and objectively defined tools for identifying these zones are Pivot Points, a cornerstone of professional technical analysis.
Why Support and Resistance Matter in Order Flow
The logic behind support and resistance is deeply rooted in order flow dynamics. When traders believe a price level is significant, they tend to cluster their stop-loss orders, limit orders, and take-profit orders around that area. This behavior is consistent across retail traders, institutional participants, and even algorithmic trading systems.
When price reaches one of these heavily populated zones, the sudden influx of buy or sell orders can dramatically alter market liquidity. As a result, price may experience sharp reversals, temporary consolidations, or strong breakouts depending on the imbalance between buyers and sellers.
The challenge arises when traders rely solely on subjective levels, such as manually drawn trendlines or isolated chart patterns. Because these levels may not be universally recognized, they often attract less trading activity. In contrast, objective levels, like Pivot Points, are calculated mathematically and viewed by a large number of market participants—making them far more influential.
Why Pivot Points Are Widely Respected
Pivot Points stand out because they are:
- Objective and rule-based
- Widely followed by professional traders
- Compatible with automated and algorithmic trading systems
- Effective across multiple timeframes
Their popularity creates a self-reinforcing effect, where increased attention leads to increased market reaction. This is especially important in highly liquid markets such as EUR/USD, GBP/USD, USD/JPY, and other major forex pairs influenced by institutions, central banks, and macroeconomic data.
The Origins of Pivot Points in Financial Markets
Before modern trading platforms and real-time analytics existed, market makers and floor traders needed a simple way to determine whether price was relatively cheap or expensive. This necessity led to the creation of Pivot Points.
Using only basic arithmetic, traders calculated a central reference price—the pivot—based on the high, low, and closing price of the previous trading period. This single value became the foundation for determining potential support and resistance zones for the upcoming session.
The most traditional version of this calculation is known as floor trader pivot points, which remain widely used today.
How Pivot Points Are Calculated
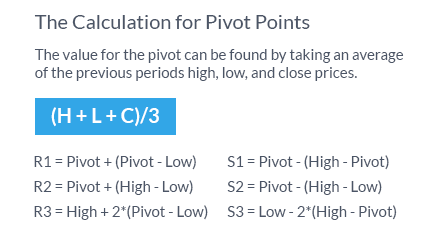
The basic pivot point formula is derived as follows:
- Pivot Point (P) = (High + Low + Close) ÷ 3
- From this pivot, three resistance levels (R1, R2, R3) and three support levels (S1, S2, S3) are calculated
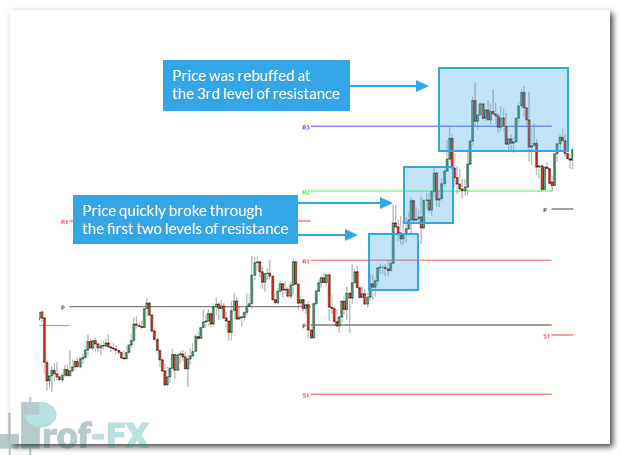
These levels provide traders with a structured price map for the trading session.
As price approaches these levels, traders monitor for potential reversals or momentum continuation. If price fails to reverse, the same levels can be used to identify breakout opportunities in the direction of the prevailing move.
Understanding Different Types of Pivot Points
The pivot points calculated using the previous day’s high, low, and close are referred to as daily pivot points. However, traders are not limited to daily calculations alone.
Many experienced traders also utilize:
- Weekly pivot points
- Monthly pivot points
The idea behind longer-term pivot points is that they incorporate more data and are therefore observed by a broader range of traders, including swing traders, position traders, and institutional participants. This increased visibility often results in stronger reactions around weekly and monthly levels.
In technical analysis, the more traders who see and respect a level, the more influential that level tends to become.
Using Pivot Points as Profit Targets
One of the most practical applications of Pivot Points is identifying potential profit-taking zones. Because price frequently reacts near these levels, they offer logical areas for traders to lock in gains.
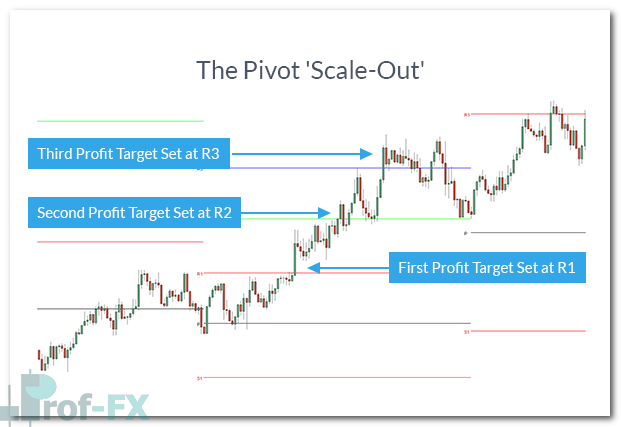
For example, in a long position:
- Traders may consider taking partial profits near R1
- Scaling out additional positions near R2 or R3
This approach allows traders to maximize gains while reducing risk, especially in trending markets influenced by macroeconomic factors such as interest rate expectations, inflation data, or central bank policy from institutions like the Federal Reserve or European Central Bank.
A similar approach applies to short positions, with profits taken near the support levels.
Scaling Out Trades Using Pivot Levels
Pivot Points also support structured scale-out strategies. Instead of exiting a position all at once, traders can place multiple limit orders at successive pivot levels.
This technique:
- Reduces emotional decision-making
- Improves consistency
- Helps traders adapt to varying levels of market volatility
Such strategies are commonly used by professional traders managing risk across dynamic market conditions.
Trading Pivot Point Breakouts
Market volatility tends to increase during specific trading sessions, particularly during the London and New York overlaps. During these periods, pivot point breakouts can become especially powerful.
When price decisively breaks through a pivot-based support or resistance level, it may signal:
- Increased momentum
- Institutional participation
- A shift in market sentiment
Breakout strategies are often most effective when applied to weekly or monthly pivot levels, where the resulting price moves can be substantial.
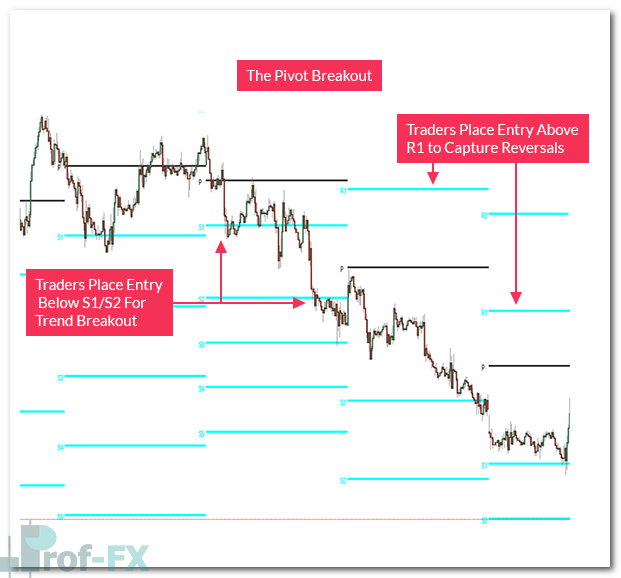
Pivot Point Reversal Strategies
Pivot Point reversals occur less frequently than breakouts because they involve counter-trend trading. Selling at resistance or buying at support requires confidence that the prevailing move is losing strength.
To improve the probability of success, traders often rely on multiple time frame analysis. For instance:
- A trader may identify a strong uptrend on the weekly chart
- Then look for buying opportunities when price tests a daily support pivot
This approach allows traders to buy at relatively favorable prices while placing tighter stop-loss orders to manage downside risk.
By aligning short-term entries with long-term trends, traders can better navigate uncertainty and improve consistency.
Final Thoughts for Beginner Traders
Pivot Points offer a structured, objective, and widely respected framework for navigating the forex market. Whether used for identifying support and resistance, setting profit targets, or planning breakouts and reversals, they remain a valuable tool across all experience levels.
For beginner traders especially, Pivot Points help transform abstract price movement into clear, actionable trading decisions, reducing guesswork and improving discipline in fast-moving financial markets.


")


