
The MACD (Moving Average Convergence Divergence) indicator is one of the most widely used technical indicators in forex trading. Its popularity comes from its versatility: MACD functions both as a trend-following indicator and a momentum oscillator, allowing traders to analyze market direction and strength using a single tool.
In this article, I will explain what the MACD indicator is, what it measures, how it is calculated, and its limitations. The explanation is structured to help beginner forex traders understand not just how MACD looks on a chart, but how and why it works in real trading conditions.
What Is the MACD Indicator?
The Moving Average Convergence Divergence (MACD) is a technical indicator designed to measure the relationship between two Exponential Moving Averages (EMAs). It visually displays changes in momentum, trend direction, and potential entry or exit points.
The MACD consists of three main components:
- MACD Line (commonly shown in blue)
- Signal Line (commonly shown in red)
- Histogram (commonly shown in green), which represents the difference between the MACD line and the signal line
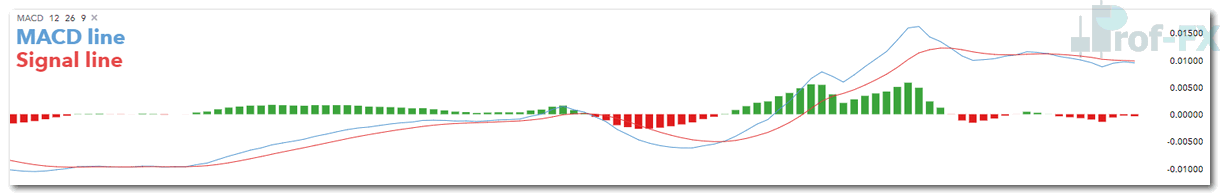
The MACD line is calculated as the difference between two EMAs—most commonly the 12-period EMA and the 26-period EMA. The signal line is typically a 9-period EMA of the MACD line.
Both lines fluctuate above and below a central zero line, giving MACD its oscillator-like behavior. This characteristic allows traders to identify overbought and oversold conditions, as well as changes in trend momentum.
What Does the MACD Indicator Measure?
At its core, MACD measures momentum and trend strength. It does this by analyzing how quickly price is moving relative to recent historical data.
MACD and Trend Direction
The zero line plays a critical role in identifying overall trend direction:
- When the MACD line crosses above the zero line, it suggests the market is entering an uptrend
- When the MACD line crosses below the zero line, it signals a downtrend
These zero-line crossovers are often used to confirm broader trend bias, especially on higher timeframes.
MACD Buy and Sell Signals
In addition to trend identification, MACD provides entry and exit signals through line crossovers:
- When the MACD line crosses above the signal line, traders interpret this as a buy signal
- When the MACD line crosses below the signal line, traders interpret this as a sell signal
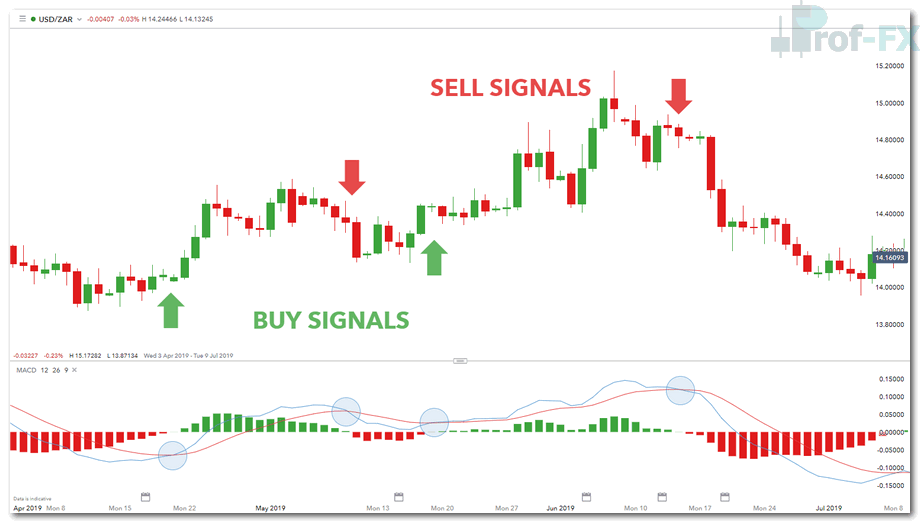
These crossover signals are particularly useful when aligned with the dominant trend and supported by additional technical confirmation.
How Is the MACD Indicator Calculated?
Most modern trading platforms – such as MetaTrader, TradingView, and cTrader – automatically calculate and display the MACD using default settings. However, understanding the calculation helps traders apply the indicator more effectively.
The standard MACD calculation involves:
MACD Line = 12-period EMA − 26-period EMA
Signal Line = 9-period EMA of the MACD Line
Histogram = Difference between MACD line and signal line
The MACD histogram visually represents the distance between the MACD line and the signal line. Its behavior provides additional insight:
- When the MACD line is above the signal line, the histogram prints positive values
- When the MACD line is below the signal line, the histogram prints negative values
- When the histogram reaches zero, it indicates a crossover between the MACD and signal lines, often marking potential buy or sell signals
This visual clarity makes MACD especially useful for traders who prefer clean and efficient chart setups.
Limitations of the MACD Indicator
While MACD is a powerful tool, it is not without limitations. Understanding these weaknesses is essential to using the indicator correctly.
MACD Works Best in Trending Markets
MACD performs most effectively in strongly trending markets. In contrast, during range-bound or consolidating markets, MACD may generate false or misleading signals.
This limitation means traders should avoid using MACD in isolation. Market structure, support and resistance, and broader trend context should always be considered.
Learning Curve for Beginner Traders
For novice traders, MACD can initially feel complex due to its multiple components and interpretations. Building a foundation in moving averages and EMA behavior is strongly recommended before relying on MACD signals.
Subjectivity and Customization
MACD settings can be adjusted in countless ways, making the indicator highly customizable—but also subjective. Different EMA parameters and timeframes can produce very different results, reducing consistency across traders.
To maintain clarity and discipline, traders should follow a structured approach when using MACD:
- Select consistent EMA parameters
- Use an appropriate timeframe for the trading strategy
- Combine MACD with complementary indicators or price action
MACD Indicator: Key Takeaways for Forex Traders
The MACD indicator is unique because it serves two purposes in one tool:
- A trend-following indicator
- A momentum oscillator
This dual functionality allows traders to reduce chart clutter while still gaining valuable market insights. When used correctly—particularly in trending conditions—the MACD can become a reliable component of a professional trading strategy.
For traders willing to invest time in understanding how momentum and trend interact, the MACD remains one of the most valuable indicators in technical analysis.
Improve Your Trading Skills with Professional Trading Education
To deepen your understanding of technical analysis, consider learning how MACD works alongside other key indicators:
- Relative Strength Index (RSI) for momentum confirmation
- Exponential Moving Average (EMA) for trend analysis
- Simple Moving Average (SMA) for long-term market direction
Every trader has a unique trading style and forex strategy. Exploring different tools and approaches will help determine whether technical analysis – and indicators like MACD – fit your personality and risk tolerance.
If you are just beginning your trading journey, start with a solid foundation by learning the basics in a Forex Course free.
Prof FX provides forex news, professional market insights, and technical analysis focused on the global currency markets, helping traders make informed and disciplined trading decisions.


