
Many traders feel that successful trading is not unlike hunting in the wild. Just as a predator on the Sahara understands that certain environments offer a higher chance of success, professional traders also learn to wait for favorable market conditions before committing capital. They do not enter trades randomly—they look for high-probability setups.
In this article, I will guide you through the chart environments that tend to produce higher-probability candlestick entries. You will also learn how to strengthen candlestick signals by combining them with pivot points and key technical levels commonly followed by traders worldwide.
Trading by Candlelight: Understanding Candlestick Charting
Candlestick charting is a method of displaying price action that clearly shows the battle between buyers and sellers. Each candle visually represents who controlled the market during a specific period, making it easier to identify potential trading signals.
Although candlestick analysis has existed for centuries—originating in Japanese rice markets—it has only been widely adopted in Western financial markets over the last few decades. Today, it is one of the most commonly used tools in forex technical analysis.
There are many individual candlestick patterns that can hint at a potential price move. Some of the most well-known formations include:
- Doji
- Hammer
- Shooting Star
Each of these patterns provides insight into market sentiment and potential turning points. Understanding how and where these candles form is far more important than memorizing their names.
Matching Candlestick Signals with Market Conditions
Before acting on any candlestick signal, traders must first identify the type of market environment they are trading. In practice, most markets fall into one of two broad categories.
Trending Market Structure
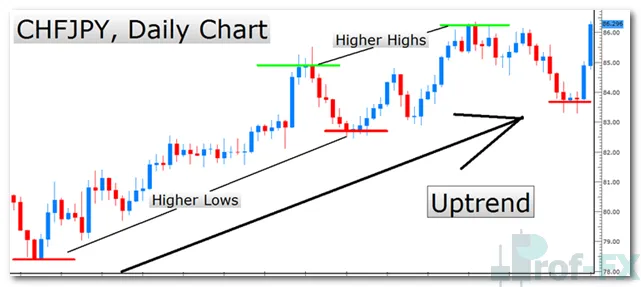
A trending market is characterized by:
- Higher highs and higher lows in an uptrend
- Lower highs and lower lows in a downtrend
In this environment, price shows directional momentum and tends to respect pullbacks before continuing in the direction of the trend.
Range-Bound Market Structure
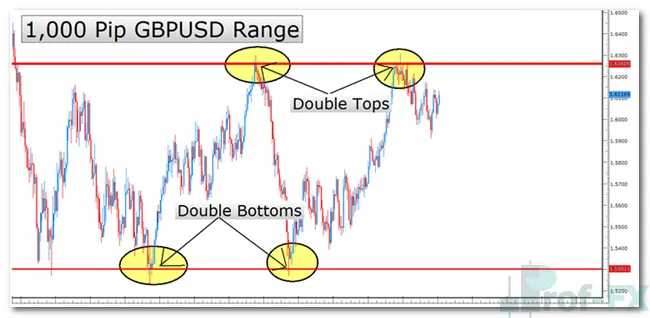
A ranging market occurs when price oscillates between support and resistance, without making sustained progress in either direction. This is the most common market condition and often appears during periods of reduced volatility or market uncertainty.
Core Rules for Higher-Probability Candlestick Entries
Once the market type has been identified, traders can apply the following foundational rules:
- In a range-bound market:
Focus on candlestick patterns that form near support or resistance. These key levels can be identified visually using price highs and lows, or more objectively with tools such as pivot points. - In a trending market:
Focus on candlestick formations that appear during pullbacks in the direction of the trend, rather than attempting to trade reversals against momentum.
To further improve accuracy, traders often combine candlestick analysis with widely followed indicators such as pivot points and long-period moving averages.
Using Pivot Points to Strengthen Candlestick Setups
Pivot points are a well-known technical indicator used to estimate potential future support and resistance levels. They are frequently monitored by retail traders, institutional participants, and algorithmic systems alike.
The central pivot point is calculated as:
P = (High + Low + Close) ÷ 3
Fortunately, traders do not need to calculate this manually. Pivot points are available as a default indicator on most professional trading platforms.
Once pivot levels are added to the chart—along with a major moving average such as the 200-period moving average—traders can monitor how price reacts when approaching these levels. This is where attention shifts to candlestick behavior, looking for signs of:
- Reversal
- Continuation
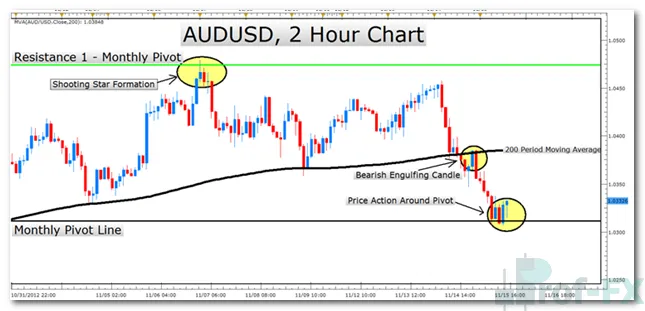
Real-World Example: AUDUSD with Pivot Points and Moving Averages
On the AUDUSD 2-hour chart, price respects and reacts strongly around the monthly pivot level. Additional confirmation appears near the 200-period moving average, reinforcing the rejection from resistance and the move back toward the pivot level.
Pivot points themselves are not predictive indicators. Their effectiveness comes from the fact that many traders watch and act on them—placing profit targets, stop-loss orders, or deciding when to stop buying or selling. This collective behavior gives pivot levels a self-fulfilling characteristic in the market.
Another Example: USDJPY Pivot Point Reaction
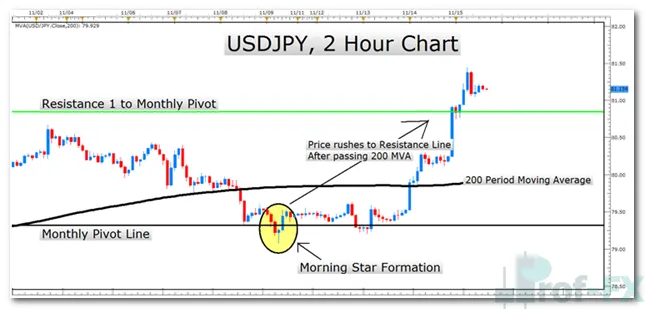
On the USDJPY 2-hour chart, price bounces from the pivot point and accelerates toward the Resistance 1 (R1) level. This type of movement illustrates how pivot points can act as decision zones where momentum either accelerates or reverses.
Risk Management and Trade Planning
The key takeaway for beginner traders is this:
When candlestick patterns align with pivot points and a major moving average, traders gain a structured framework for:
- Entry placement
- Stop-loss positioning
- Profit target selection
A common approach is to:
- Place the stop-loss below the candlestick signal
- Target profits near the next support or resistance level
This method helps maintain sound risk management while increasing the probability of entering trades under favorable conditions.
Final Thoughts
Higher-probability candlestick entries do not come from trading every candle. They come from patience, context, and structure. By identifying the market environment, waiting for price to reach key technical levels, and then using candlestick patterns as confirmation, traders place themselves in a far stronger position.
Trade smart, manage risk carefully, and always wait for the market to come to you.
Happy trading.


