
I often get questions from traders to check a chart they took a screenshot from. The first thing I do is look up the same currency pair in my own charting platform. Why do you think this is?
As a discretionary trader, I value my chart layout as much as the chart patterns I look for. For many traders, chart-based discretionary trading means finding things like support and resistance, candlestick patterns and trend lines. You discover patterns in how the price behaves. This is the basis of price action theory.
Yet, not a lot of trading literature discusses the importance of getting used to how your charts look: the colours of the candlesticks, both the horizontal and the vertical scale, how compressed your charts look, colours of indicators, how you draw support and resistance, white or dark background, and so on.
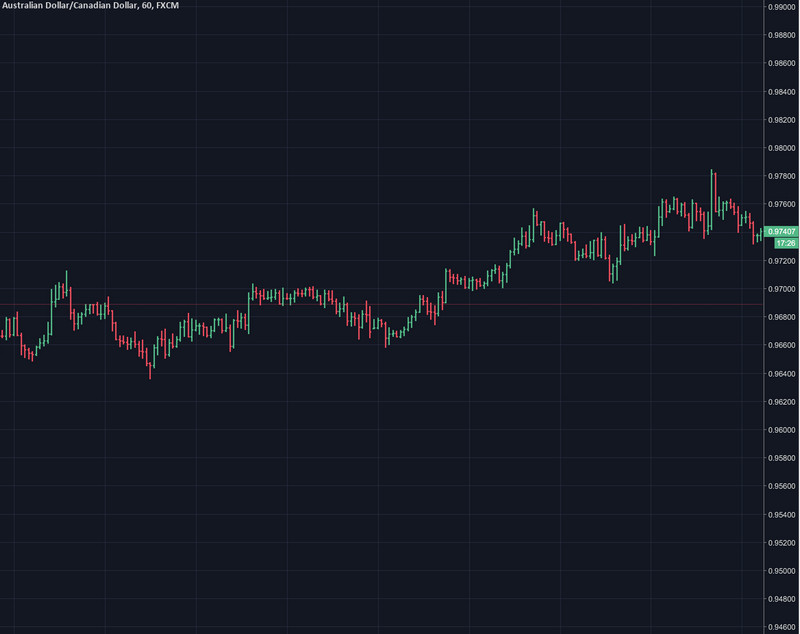
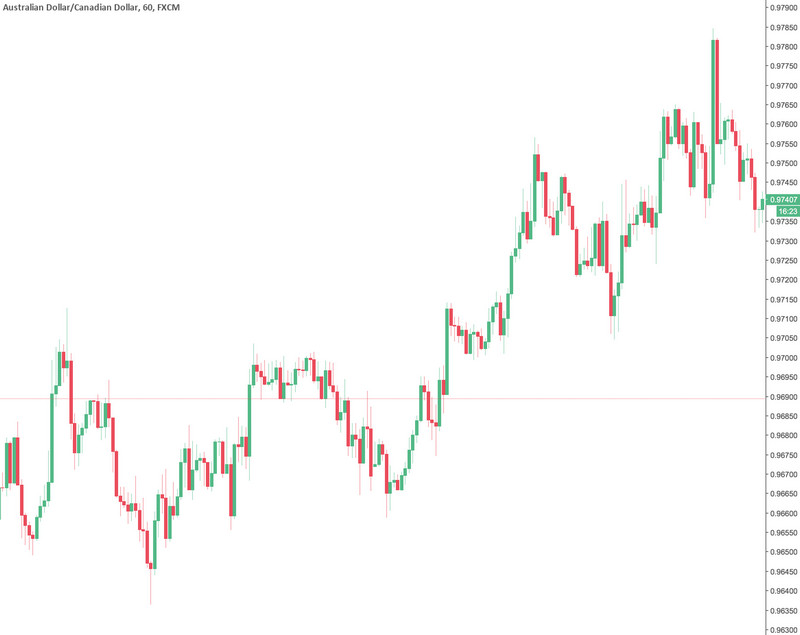
The two charts above show exactly the same instrument, for exactly the same period. Yet the colour is different, the scale is different, the charting method is different (candles vs bars). These differences are enough to draw different conclusions because they don’t look like the charts you’re used to.
Read also: Forex Trading Tips – Read and Using Support Resistance
In a business where pattern detection determines whether you earn or lose money, these things matter! Two charts might show the same currency pair, but if you’re used to analyzing your charts using a specific layout, you might come up with a different conclusion, just because you interpret what you see differently.
The way I view the charts is part of my edge.
Chart Layout Hopping
My familiarity with one specific chart layout is one of the reasons why I never trade using mobile apps. I use TradingView for chart analysis and won’t even look at the charts of my MT4 or cTrader desktop or mobile app. They look different, which makes them hard to interpret for me.
Part of my routine is doing exactly the same things, in the most predictable manner. It includes the way how I prepare for the week, scan the markets for setups and, indeed, the layout of my charts. Even the colours of my candlesticks will stay the same for this exact reason. This chart layout hopping is the equivalent of trading strategy hopping and it won’t help you become a better trader.
If you’re using TradingView, I recommend you to take a look at the chart settings. Especially the Lock scale setting is interesting: enabling it makes sure that the scale of your chart never changes. Sure, you can zoom in and out, but the scale will always stay the same, which will result in you viewing your charts in exactly the same way, over and over again.

Configure something you’re comfortable with, save it as a template and then stick with it. Part of your edge is being able to spot setups, so it doesn’t make sense to make it difficult for your brain to keep switching the visual cues.
Try it yourself and see the results!


