
Understanding forex trading time frames is one of the most important skills a beginner trader must develop early. Time frames help traders see both the bigger market trend and the short-term price movements that create trade opportunities. When used correctly, switching between time frames can sharpen analysis and improve execution. When used incorrectly, it can create confusion and conflicting signals.
This beginner-friendly guide explains what forex time frames are, why they matter, the challenges they present, and how traders can apply them effectively from their very first trade.
What Are the Main Forex Trading Time Frames?
Forex trading time frames are generally grouped into long-term, medium-term, and short-term categories. Traders may choose to focus on a single time frame or, more commonly, combine a higher time frame for trend analysis with a lower time frame for trade entries.
Common Forex Time Frames by Trading Style
| Time Frame Category | Trading Style | Trend Time Frame | Trigger Time Frame |
| Long-term | Position trading | Weekly | Daily |
| Medium-term | Swing trading | Daily | 4-hour |
| Short-term | Day trading | 4-hour | Hourly |
| Very short-term | Scalping | Hourly | 15-minute |
Longer time frames help traders identify trade setups and market direction, while shorter time frames help traders fine-tune entries, exits, and risk management.
How Time Frame Analysis Impacts Forex Trades
Switching between different forex time frames provides traders with multiple perspectives on the same currency pair. This is especially powerful in forex due to two key characteristics of the market.
1. High Liquidity in Forex Markets
The forex market is the most liquid financial market in the world. Because of this liquidity, even very short time frames—such as 5-minute or 15-minute charts—can provide meaningful price information.
In contrast, illiquid assets (such as certain stocks) may show little to no movement on short time frames, making them less useful for analysis.
2. The 24-Hour Forex Market
Forex trades 24 hours a day during the week, across different global sessions:
- Asian session: often range-bound and lower volatility
- European session: increased volume and trend development
- US session: strong momentum, especially during news releases
By switching between time frames during these sessions, traders can adapt to changing volatility, liquidity, and market behavior. For example:
- Shorter time frames may suit range trading during Asia
- Higher and medium time frames may capture trends during the Europe–US overlap
What Forex Time Frame Should Beginners Trade?
A common beginner question is: “Is there one best time frame to trade forex?”
The short answer is no.
The best time frame depends on:
- Your trading style
- Your risk tolerance
- How much time you can dedicate to trading
- Your preferred trading strategy
To choose an appropriate time frame:
- Identify your trading style (position, swing, day trading, or scalping)
- Select a chart you feel comfortable analyzing
- Apply consistent technical analysis
- Always implement sound risk management
For most beginners, higher time frames (daily and 4-hour charts) are often more forgiving and easier to interpret than fast-moving lower time frames.
Matching Forex Time Frames with Trading Strategies
One of the biggest challenges traders face is conflicting signals across time frames. For example:
- The daily chart shows an uptrend
- The hourly chart shows a short-term downtrend
This contradiction can cause hesitation and poor decision-making unless the trader has a clear plan.
The solution is to align time frames with your trading strategy rather than reacting emotionally to every chart.
Swing Trading Example: Seeing the Bigger Picture
A swing trader following a trend-following strategy should avoid making decisions based solely on short-term price movements.
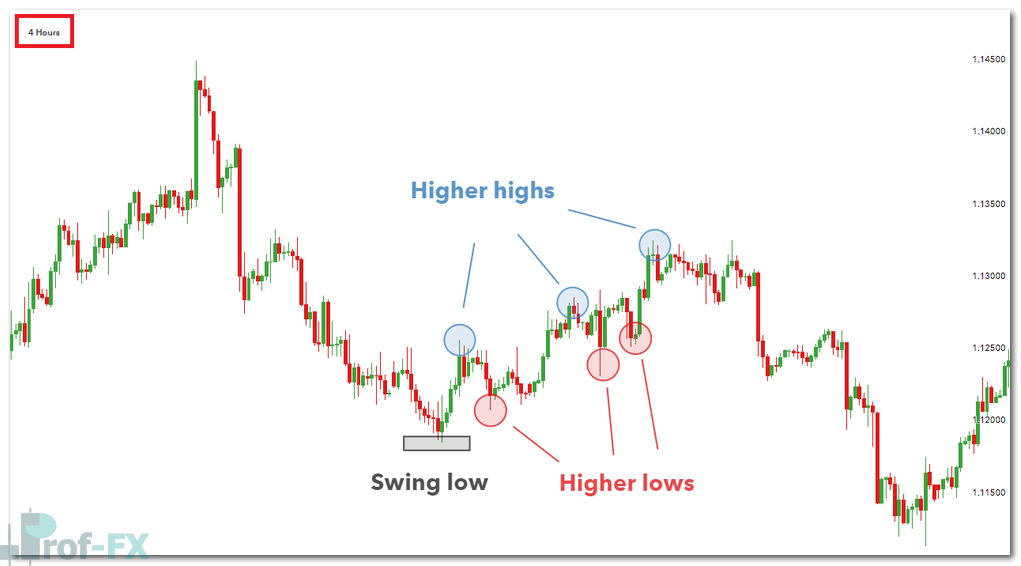
In the example below, the 4-hour chart suggests a potential trend reversal, which may tempt traders to enter prematurely.
4-hour EUR/USD chart suggesting a reversal
However, when stepping back to the daily chart, it becomes clear that the broader downtrend remains intact.
Daily EUR/USD chart showing trend continuation
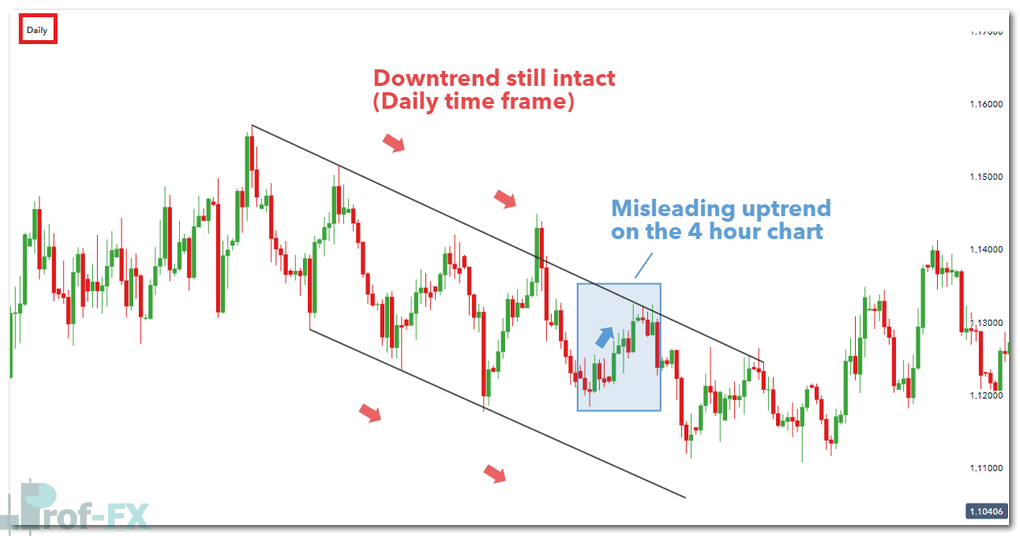
This demonstrates why higher time frames are essential for context and directional bias, while lower time frames are better suited for entry timing.
Using Multiple Time Frame Analysis in Forex Trading
Rather than relying on a single chart, many traders adopt Multiple Time Frame Analysis (MTFA). This involves analyzing the same currency pair across two or more time frames.
How MTFA Works in Practice
- Higher time frame: Establishes trend direction and market bias
- Lower time frame: Identifies precise entry and exit points
This approach allows traders to:
- Avoid trading against the dominant trend
- Improve risk-reward ratios
- Increase confidence in trade setups
The key is to keep analysis simple, not overloaded with indicators or excessive charts.
Technical Analysis Techniques by Time Frame
Techniques for Identifying the Trend (Higher Time Frames)
Higher time frames—such as the daily and weekly charts—are best suited for identifying the primary market trend. At these levels, price action reflects the behavior of larger market participants, including institutions, banks, and long-term investors, making trends more reliable and less noisy.
Trendlines and Market Structure
Trendlines are one of the most fundamental tools for identifying trend direction. They are drawn by connecting:
- Higher lows in an uptrend
- Lower highs in a downtrend
When price consistently respects a trendline, it confirms the presence of a structured trend. Market structure reinforces this analysis by observing whether price is forming:
- Higher highs and higher lows (uptrend)
- Lower highs and lower lows (downtrend)
On higher time frames, breaks in market structure often signal trend exhaustion or reversal, making them valuable early warning signs for traders.
200-Day Moving Average (Daily Charts)
The 200-day moving average (200 MA) is one of the most widely respected long-term trend indicators in financial markets. On the daily chart, it serves as a dynamic support or resistance level.
General interpretations include:
- Price above the 200 MA → bullish long-term bias
- Price below the 200 MA → bearish long-term bias
Many institutional traders use the 200 MA as a trend filter, only taking trades in the direction of the prevailing trend. Because of its popularity, price often reacts strongly around this level, further reinforcing its importance.
Moving Average Convergence Divergence (MACD)
The MACD indicator helps traders assess trend direction, momentum strength, and potential reversals. On higher time frames, MACD is particularly effective at smoothing out short-term fluctuations.
Key MACD signals include:
- MACD line above signal line → bullish momentum
- MACD line below signal line → bearish momentum
- Divergence between MACD and price → potential trend weakening
Used in combination with price structure, MACD helps confirm whether a trend is healthy, slowing, or at risk of reversal.
Techniques for Identifying Entry Levels (Lower Time Frames)
Lower time frames—such as the 4-hour, 1-hour, or intraday charts—are used to refine trade timing and execution. Once the broader trend is identified on higher time frames, traders shift lower to look for low-risk entry opportunities.
Moving Average Crossovers
Moving average crossovers are commonly used to identify changes in short-term momentum. This technique involves two moving averages, typically:
- A faster moving average (e.g., 10 or 20-period)
- A slower moving average (e.g., 50-period)
When the faster moving average crosses:
- Above the slower one → bullish entry signal
- Below the slower one → bearish entry signal
On lower time frames, crossovers are best used in the direction of the higher time frame trend to reduce false signals.
Candlestick Pattern Analysis
Candlestick patterns provide visual confirmation of price behavior and trader sentiment. On lower time frames, they are particularly effective for identifying:
- Entry confirmation
- Rejection at key levels
- Short-term reversals or continuations
Common entry-focused candlestick patterns include:
- Bullish and bearish engulfing
- Pin bars / long wicks
- Inside bars
These patterns are most reliable when they form near support, resistance, or demand and supply zones.
Key Support and Resistance Levels
Support and resistance levels represent price areas where buying or selling pressure previously dominated. On lower time frames, these levels help traders:
- Define precise entry zones
- Place logical stop-loss orders
- Set realistic profit targets
Support and resistance are best drawn from higher time frames and executed on lower ones, ensuring alignment between structure and execution.
Momentum Indicators: RSI and MACD
Momentum indicators help traders assess whether price has enough strength to continue moving in a given direction.
- Relative Strength Index (RSI) identifies overbought and oversold conditions and highlights divergence between price and momentum
- MACD, when applied to lower time frames, helps confirm momentum shifts and entry timing
Used together, these indicators help traders avoid entering trades when momentum is fading or already exhausted.
Bringing It All Together
Professional traders do not treat these tools in isolation. Instead, they use:
- Higher time frame tools to define direction and bias
- Lower time frame tools to optimize entry, risk, and reward
For beginner traders, mastering this structured approach builds discipline, clarity, and consistency—key traits for long-term success in forex trading.
Final Thoughts: Why Forex Time Frames Matter
Forex time frames are not just chart settings—they are decision-making tools. When aligned with a trader’s strategy, they help filter noise, clarify trends, and improve execution.
For beginner traders, the most important takeaways are:
- Start with higher time frames
- Use lower time frames only for precision
- Avoid overanalyzing conflicting charts
- Apply multiple time frame analysis with discipline
Mastering time frames early creates a strong foundation for long-term trading success.
Further Reading and Learning
- Download a free forex trading guide to build core skills
- Join live trading webinars to see how professionals apply time frames in real markets
- Continue studying trading styles to discover which approach suits you best
The market looks very different depending on the time frame you choose—successful traders know when to zoom in and when to step back.


