

Deciding when to enter a forex trade is one of the most challenging skills for both new and experienced traders. The foreign exchange market is influenced by multiple variables – price action, liquidity, macroeconomic data, central bank policy, and trader sentiment – which makes precise timing critical.
In this article, I will walk you through three proven forex trading entry strategies that professional traders commonly use. The goal is to help you understand how and why these methods work, so you can apply them confidently in real market conditions.
We will focus on the following entry approaches:
- Trend channels
- Candlestick patterns
- Breakout trading
These strategies are widely used in technical analysis and are suitable for traders who want a structured, disciplined approach to entering the forex market.
When Is the Best Time to Enter a Forex Trade?
There is no single “best” time that applies to all traders. The optimal entry point depends on your trading style, strategy, and market conditions. Some traders focus on trending markets, others prefer range-bound environments, while some specialize in high-volatility breakout scenarios.
The three entry strategies discussed in this article represent popular and practical approaches, but they are not the only ones available. Professional traders often combine these methods with economic calendars, central bank decisions (such as Federal Reserve or ECB policy), and market sentiment analysis to refine their entries.
Understanding how to enter a trade is just as important as knowing what to trade.
Why Entry Timing Matters in Forex Trading
Accurate entry points help traders:
- Reduce unnecessary drawdowns
- Improve risk-to-reward ratios
- Avoid emotional decision-making
- Increase overall trade consistency
This is why professional traders rely on clear rules and confirmation signals, rather than guessing market direction.
Forex Entry Strategy #1: Trading with Trend Channels
Trend channels are among the most fundamental tools in technical analysis. They are built using trendlines that connect higher highs and higher lows in an uptrend, or lower highs and lower lows in a downtrend.
When a currency pair is trending, traders can establish a directional bias:
- Buy near support in an uptrend
- Sell near resistance in a downtrend
This structured approach allows traders to trade with the prevailing market momentum rather than against it.
In the example below, price action shows a clear series of higher highs and higher lows, confirming a strong uptrend. This provides traders with a logical framework for entering long positions near support and targeting resistance.
Once price breaks out of the trend channel, traders should be alert for:
- A potential trend continuation breakout
- Or a trend reversal, depending on confirmation
Forex entry strategy using trend channels (Weekly USD/ZAR chart):
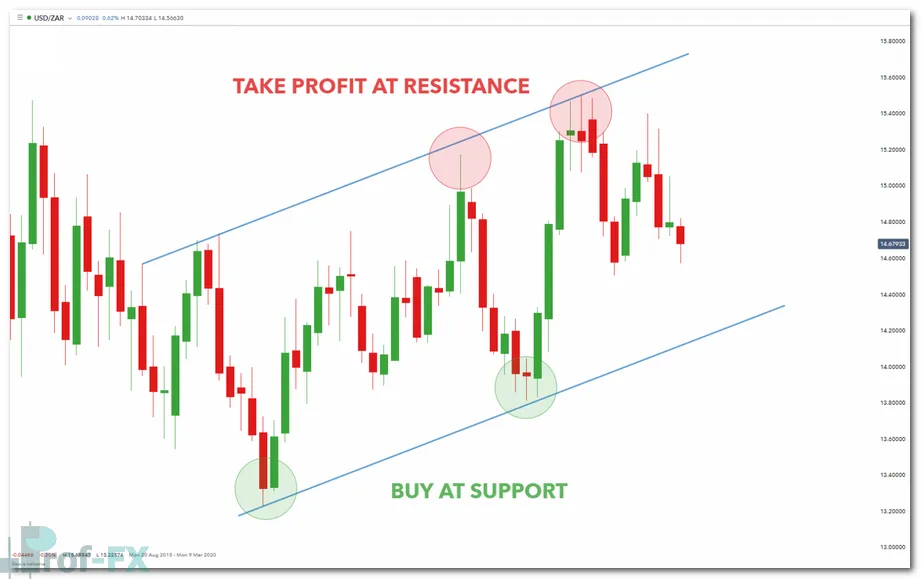
Trend channel trading is particularly effective when combined with broader market context, such as interest rate differentials, emerging market risk sentiment, and U.S. dollar strength.
Forex Entry Strategy #2: Candlestick Pattern Confirmation
Candlestick patterns are powerful visual tools that help traders identify potential market reversals or continuations. Patterns such as the hammer, engulfing, and shooting star are frequently used by experienced forex traders.
In the example below, a hammer candlestick appears on the EUR/USD daily chart. This pattern often signals a potential bullish reversal after a downtrend.
However, it is important to understand that a candlestick pattern alone is not an entry signal.
Professional traders wait for confirmation, which helps filter out false signals and improves probability.
Hammer candlestick trade entry (Daily EUR/USD chart):
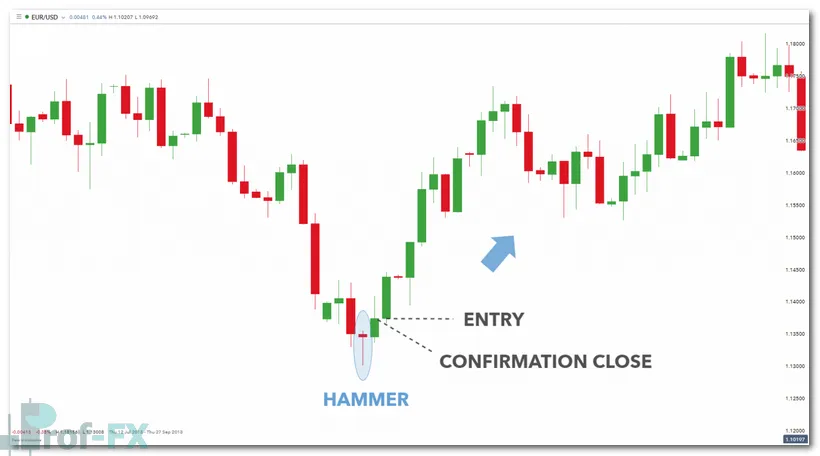
In this case, confirmation occurs when price closes above the high of the hammer candle. This confirms bullish intent and strengthens the validity of the reversal signal.
By waiting for confirmation:
- Risk exposure is reduced
- Trade entries become more precise
- False breakouts are minimized
Many traders also combine candlestick analysis with technical indicators, price structure, and macroeconomic news. For simplicity, this article isolates candlestick entries as a standalone strategy.
Forex Entry Strategy #3: Breakout Trading
Breakout trading is one of the most widely used entry strategies in the forex market, especially among novice traders. The concept is straightforward: traders identify key support or resistance levels and enter trades when price decisively breaks through them.
A breakout occurs when price moves beyond a clearly defined level, often accompanied by:
- Increased trading volume
- Strong momentum
- Expansion in volatility
Price action skills are essential for successful breakout trading, as false breakouts are common in low-liquidity environments.
In the example below, price breaks below a key support level on the USD/JPY daily chart. The increase in volume supports the bearish breakout, providing additional confirmation.
Forex entry strategy using breakouts (Daily USD/JPY chart):
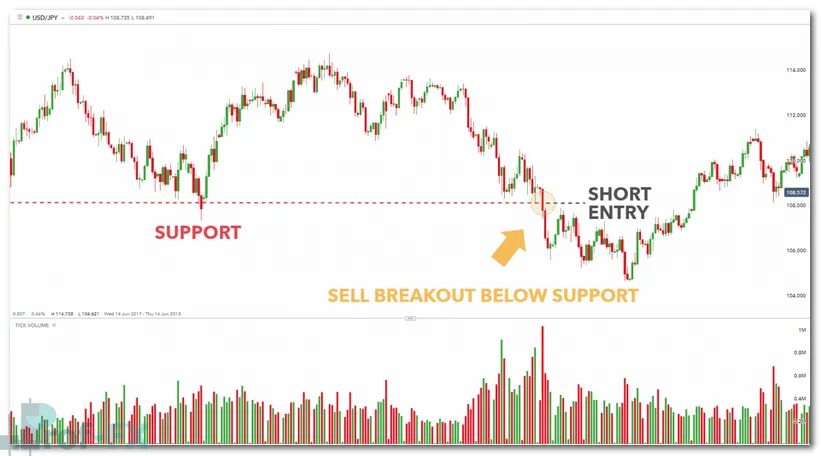
Some traders enter immediately upon the break, while others wait for a confirmation candle close outside the level to reduce risk.
Breakout strategies are particularly effective during:
- Major economic data releases
- Central bank announcements
- High-liquidity trading sessions
Popular Forex Entry Indicators Used by Traders
Technical indicators are rarely used in isolation. Instead, they function as confirmation tools that help traders validate entry decisions already supported by price action, market structure, or broader trend direction. The true effectiveness of any indicator lies in how well it aligns with the trader’s chosen strategy, timeframe, and prevailing market conditions.
For beginner traders, understanding how and when to use indicators is more important than using many of them at once. Below are some of the most commonly used and time-tested forex entry indicators, along with practical explanations of how professional traders apply them.
Relative Strength Index (RSI)
The Relative Strength Index (RSI) is a momentum oscillator that measures the speed and magnitude of recent price movements. It is primarily used to identify overbought and oversold conditions, typically using the 70 and 30 levels as reference points.
In range-bound markets, RSI is particularly effective. When price approaches resistance and RSI moves above 70, traders look for potential selling opportunities. Conversely, when price nears support and RSI falls below 30, it may signal a potential buying opportunity.
In trending markets, professional traders often adjust their interpretation of RSI. Rather than focusing solely on overbought or oversold levels, they look for:
- RSI holding above 40–50 in uptrends
- RSI holding below 50–60 in downtrends
This approach allows traders to use RSI as a trend confirmation tool, rather than an early reversal signal that could lead to premature entries.
Moving Average (MA) Crossovers
Moving averages are among the most widely used indicators in forex trading due to their simplicity and effectiveness. Moving Average crossovers occur when a shorter-term moving average crosses above or below a longer-term moving average, signaling a potential change in trend direction.
Common combinations include:
- 20-period and 50-period moving averages
- 50-period and 200-period moving averages
When a short-term MA crosses above a long-term MA, it often signals bullish momentum and potential long entries. When it crosses below, it may indicate bearish momentum and short-selling opportunities.
Professional traders typically avoid taking MA crossover signals in isolation. Instead, they confirm entries by ensuring:
- Price structure supports the trend direction
- The crossover occurs near a key support or resistance level
- The broader trend on higher timeframes aligns with the signal
This helps reduce lag-related false signals, which are common when markets are choppy or consolidating.
MACD (Moving Average Convergence Divergence)
The MACD is a versatile indicator that combines trend-following and momentum analysis. It consists of the MACD line, signal line, and histogram, each offering insight into market strength and direction.
MACD is commonly used to identify:
- Momentum shifts through line crossovers
- Trend continuation through histogram expansion
- Potential exhaustion when momentum weakens
In trending markets, traders often take MACD crossover signals in the direction of the prevailing trend, rather than counter-trend signals. This improves trade probability and aligns entries with dominant market forces.
MACD is especially useful when combined with:
- Trend channels
- Breakout structures
- Higher-timeframe trend confirmation
Using Indicators as Confirmation, Not Decision-Makers
A critical lesson for forex traders—especially beginners—is that indicators do not predict price, they interpret it. Relying on indicators alone can lead to delayed entries and inconsistent results.
Professional traders use indicators to:
- Confirm trade bias
- Improve timing
- Filter low-quality setups
The most reliable forex entries occur when price action, market structure, and indicator signals align. This disciplined approach reduces emotional trading and builds long-term consistency.
Forex Entry Strategies: Key Takeaways
To build confidence and consistency in forex trading, traders should:
- Develop a solid foundation in technical analysis
- Understand the differences between technical and fundamental drivers
- Learn how major economic entities such as central banks, inflation data, and interest rates influence price movement
- Become familiar with high-probability candlestick patterns
- Practice disciplined entry execution using clear rules
A strong entry strategy does not guarantee profits, but it significantly improves decision-making and long-term performance.
Prof FX delivers forex news, market insights, and technical analysis covering the macroeconomic forces, price trends, and trading strategies that shape the global currency markets.


