Core Point and Figure Chart Patterns

Core Point and Figure Chart Patterns pdf

Synopsis E-book: Core Point and Figure Chart Patterns

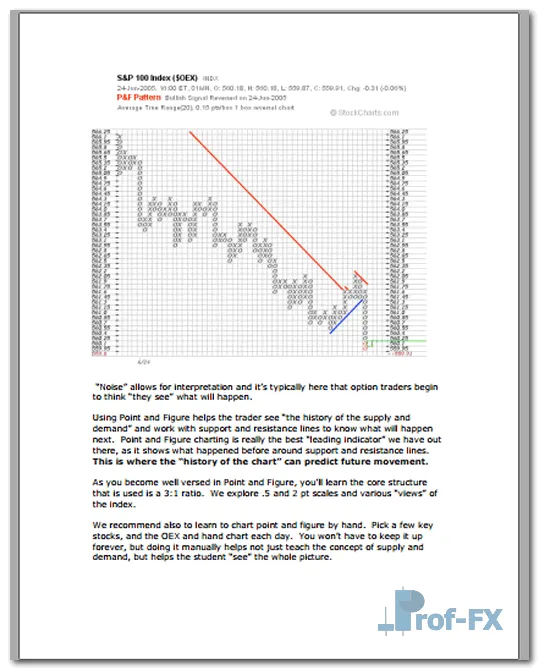
Charles Dow invented the basics of “supply and demand” charting, point and figure, in the late 1800’s. It’s been used ever since. Charts effectively show “historical perspectives” best, and chartists are always watching to see what leading indicators will predict “what’s next.”
Using point and figure as a methodology for seeing prior supply and demand also helps the chartist eliminate “noise.” “Noise” is what we call “too much information, and too many facts” that are put in front of the average investor. Many option traders wrongly believe that the more charting and detailed information (bells and whistles) they have to trade with, the better. This is dangerously wrong.


Preview Core Point and Figure Chart Patterns

Core Point and Figure Chart Patterns pdf Core Point and Figure Chart Patterns pdf Core Point and Figure Chart Patterns pdf

Download E-book Core Point and Figure Chart Patterns

  • Core Point and Figure Chart Patterns.pdf
  • Size: 784 kb
  • Author: – | Language: English | Dir.: Part2 | Request Remove!
Forex Advertising rectangle - headway
Forex Advertising Package
Gravatar Image
FX Script is a collective of skilled forex traders with extensive knowledge of MetaTrader indicators. Known for their expertise, they regularly contribute to Prof FX, offering practical trading tips and advanced strategies to guide traders towards success in the forex market.

Leave a Reply

Your email address will not be published. Required fields are marked *

Using Fibonacci Retracement in Trading

Fibonacci Retracements is one of the widely used tools by traders for technical analysis. Principally, the tool helps in identifying

How Professional Traders Read ISM Data

The ISM Manufacturing Index is a cornerstone of forex trading, offering critical insights into global economic activity and influencing currency

Mastering Bearish & Bullish Pennants

Pennant patterns are powerful continuation signals in the forex market, often leveraged by traders to anticipate potential price movements. While

Top 3 Triangle Patterns Forex Traders Must Know

Triangle patterns come in three main variations and are a common sight in the forex market. These patterns provide traders

Use Average True Range

The Average True Range (ATR), developed by J. Welles Wilder is referred to as an technical analysis indicator that measures

How to Trade the Evening Star Candlestick Pattern

The Evening Star candlestick formation is one of the most respected three-candle reversal signals in technical analysis. For forex traders,

What Does Your Economy Export

Why do we care what goods or services a country exports? We care because if we know the primary goods and services

Forex Spread and Dealers

A dealer is different than a broker, though there are broker/dealers. A dealer is who makes a market, which is