
Technical analysis has become one of the most widely used approaches in modern trading. With the rapid development of advanced charting software and online trading platforms, traders now have instant access to price data, indicators, and analytical tools that were once reserved for institutions.
However, for beginner traders, understanding what technical analysis really is—and how it can be applied effectively—often feels overwhelming at first.
This guide is designed to introduce the core principles of technical analysis in a clear, structured, and beginner-friendly way, while maintaining professional standards used by experienced traders and analysts.
What Is Technical Analysis in Trading?
Technical analysis is the study of price movement in financial markets. Rather than focusing on economic reports or company fundamentals, technical traders analyze historical price data, chart patterns, and indicators to anticipate future market behavior.
At its core, technical analysis provides a visual representation of market psychology. By studying how price has behaved in the past—and how traders reacted at certain levels—technical analysts attempt to identify potential trends, reversals, and continuation patterns before entering a trade.
This approach relies on three core components that form the foundation of technical analysis and guide how traders interpret market behavior.
Price action
Price action is the starting point of all technical analysis. It refers to the direct movement of price on a chart without relying heavily on external indicators. By observing how price reacts at key levels such as support and resistance, traders gain insight into market sentiment, buying and selling pressure, and potential trend direction. Price action reflects the collective decisions of all market participants and often provides the clearest and most immediate trading signals.
Technical indicators
Technical indicators are mathematical tools derived from price and, in some cases, volume. Indicators such as Moving Averages, RSI, and MACD help traders quantify market behavior that may not be immediately obvious from price alone. They are commonly used to confirm trends, identify momentum, highlight overbought or oversold conditions, and improve timing for trade entries and exits. While indicators should never replace price analysis, they serve as valuable confirmation tools when used correctly.
Chart patterns
Chart patterns represent recurring formations that develop as markets move between periods of consolidation and expansion. Patterns such as rectangles, triangles, flags, and head and shoulders reflect shifts in market psychology and often signal potential continuation or reversal scenarios. Recognizing these patterns allows traders to anticipate possible breakouts or trend changes and prepare structured trading plans in advance.
Together, these elements help traders make informed, probability-based decisions rather than relying on predictions or emotional reactions. By combining price action, indicators, and chart patterns, traders create a structured framework that emphasizes risk management, consistency, and disciplined execution—key principles in professional forex trading.
How Technical Analysis Works
Technical analysis involves interpreting patterns directly from charts. Traders study historical data—primarily price and volume—to identify recurring behaviors that tend to repeat over time.
Indicators are then applied to charts to help traders determine:
- Potential entry points
- Logical exit levels
- Favorable risk-reward ratios
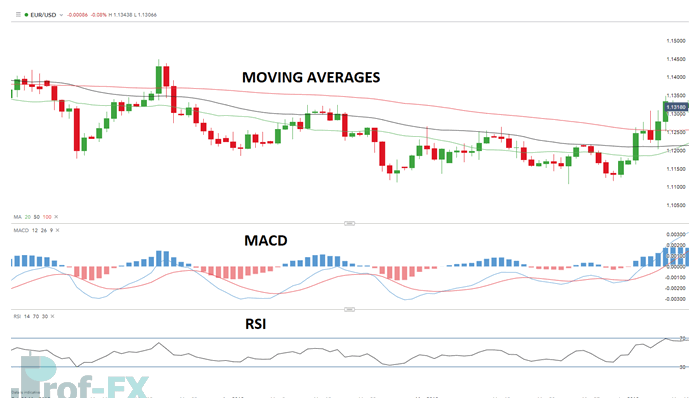
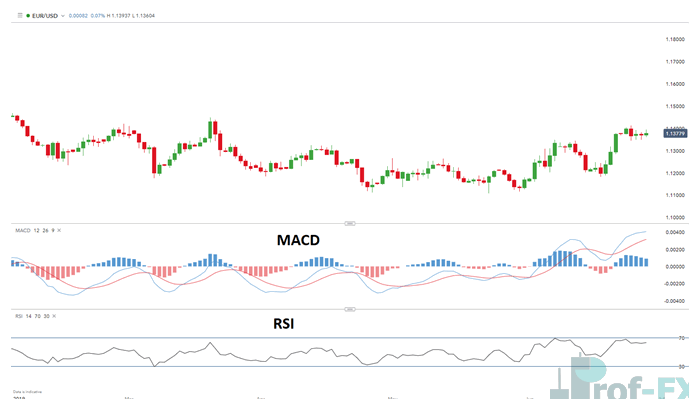
Below is an example of a trading chart using two popular indicators: MACD and RSI.
While proponents of fundamental analysis argue that economic data drives price movement, technical analysts believe that all known information is already reflected in price. As a result, past price behavior can offer valuable insight into future market direction.
In practice, many professional traders combine technical and fundamental analysis, using fundamentals to establish market bias and technicals to fine-tune execution.
Why Technical Analysis Is Valuable for Traders
One of the biggest challenges traders face is risk management, and technical analysis plays a crucial role in addressing this. Once traders understand how to read charts and identify key levels, they can define risk more precisely and avoid emotional decision-making.
Another key advantage is flexibility. Technical analysis can be applied to:
- Any market (forex, commodities, indices, equities, crypto)
- Any timeframe (seconds to monthly charts)
While fundamental analysis focuses on intrinsic value, technical analysis focuses on market trends—which are often influenced by underlying fundamentals anyway.
Key Benefits of Technical Analysis
- Can be applied across all markets and timeframes
- Can be used as a standalone trading method
- Helps traders identify trends, ranges, and momentum
Using Charts in Technical Analysis
Charts are the foundation of technical analysis. Since price is the most accurate reflection of market behavior, charting price action is the starting point for any technical study.
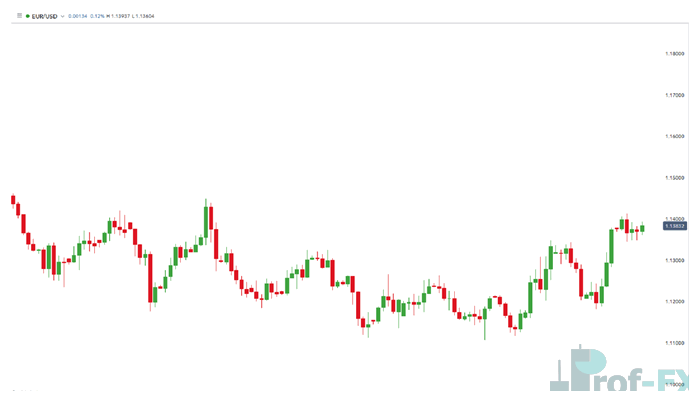
Below is an example of a candlestick chart for the EUR/USD currency pair.
Charts help traders determine:
- Overall market direction (uptrend or downtrend)
- Short-term vs long-term trends
- Range-bound or consolidating conditions
The three most common types of technical analysis charts are:
- Line charts
- Bar charts
- Candlestick charts
Candlestick charts are especially popular among forex traders because each candle clearly displays:
- Opening price
- Highest and lowest price
- Closing price
The relationship between candles often reveals valuable information about momentum, indecision, and potential reversals.
Once traders become comfortable reading charts, they can then enhance their analysis by incorporating indicators.
Introduction to Technical Indicators
Technical indicators are mathematical calculations derived from price data, volume data, or a combination of both. Their primary function is to transform raw market data into visual signals that help traders interpret market conditions more objectively. Rather than guessing market direction, indicators allow traders to evaluate probability, momentum, and trend behavior in a structured way.
In practical trading, indicators are commonly used to identify potential trading opportunities, confirm whether a trend is strong or weakening, and validate trade setups before execution. While no indicator can predict the market with certainty, they help traders reduce subjectivity and improve consistency in decision-making.
Most traders rely on price-based and volume-based indicators, as these directly reflect market participation and sentiment. These indicators assist traders in several key areas.
Identifying support and resistance levels
First, they help in identifying support and resistance levels, which are price zones where buying or selling pressure has historically emerged. Indicators such as moving averages, pivot points, and volume-based tools can highlight areas where price is more likely to react, stall, or reverse.
Measuring trend strength
Second, indicators are used for measuring trend strength. Tools like MACD, ADX, and moving averages allow traders to assess whether a trend is gaining momentum, losing strength, or transitioning into consolidation. This insight is essential for avoiding low-quality trades during choppy or directionless markets.
Estimating trend duration
Third, indicators assist in estimating trend duration by signaling whether a trend may continue or approach exhaustion. Oscillators such as RSI help traders recognize overbought and oversold conditions, which can indicate potential slowing or correction within a broader trend.
Technical analysis also enables traders to apply multiple timeframe analysis, a critical skill in professional trading. By analyzing price action across different time horizons—from seconds and minutes to daily, weekly, or even monthly charts—traders gain a more complete understanding of market structure. Higher timeframes help define the dominant trend and key levels, while lower timeframes assist with precise entries and exits.
When used together, indicators and multiple timeframe analysis provide traders with context, confirmation, and clarity, allowing for better-aligned trades that respect both short-term price behavior and broader market direction.
Most Common Technical Analysis Indicators
Some of the most widely used indicators in technical analysis include:
- Moving Averages
- Relative Strength Index (RSI)
- Moving Average Convergence Divergence (MACD)
In practice:
- Moving Averages and MACD are commonly used to identify trend direction
- RSI is often used to spot overbought and oversold conditions, helping traders refine entry and exit points
Below is an example of the EUR/USD chart using multiple indicators together.
Indicators should be viewed as decision-support tools, not decision-makers. They work best when combined with solid price action analysis and disciplined risk management.
Continuing Your Technical Analysis Education
Before moving into advanced strategies, traders should ensure they are comfortable with:
- The main types of technical analysis charts
- Basic candlestick patterns
- Trend identification and confirmation
To deepen your understanding, consider following professional technical analysis news, attending live market webinars, and studying the psychological traits shared by consistently successful traders.
Building a strong foundation in forex technical analysis allows traders to approach the markets with clarity, structure, and confidence—qualities that separate disciplined professionals from emotional speculators.
Prof FX provides forex news and technical analysis covering the trends that influence global currency markets.


