
Support and resistance trading is one of the most foundational pillars in technical analysis. Almost every trading strategy—whether discretionary or systematic—incorporates some form of support and resistance (S/R) analysis. These levels develop around price zones where the market has repeatedly approached, paused, or reversed, revealing areas of strong buying or selling interest.
In this guide, I will explain what support and resistance really mean, how professional traders interpret these levels, and walk you through the most effective support and resistance trading strategies. The goal is to help beginner traders understand not just where to draw levels, but how to trade them in real market conditions.
At Prof FX, we also provide a dedicated support and resistance overview highlighting key levels across major currency pairs, commodities, indices, and cryptocurrencies to help traders stay aligned with the broader market structure.
What Is Support and Resistance in Trading?
Support and resistance is one of the most widely used technical analysis techniques across global financial markets. With a quick look at a chart, these levels help traders answer three critical questions:
- What is the current market direction?
- Where is a logical entry point?
- Where should the trade be exited—either for profit or loss?
If a trader can clearly define these three elements, they already have the foundation of a solid trading idea. Identifying support and resistance levels allows traders to structure trades with clarity, discipline, and risk control.
Understanding Support in Forex Trading
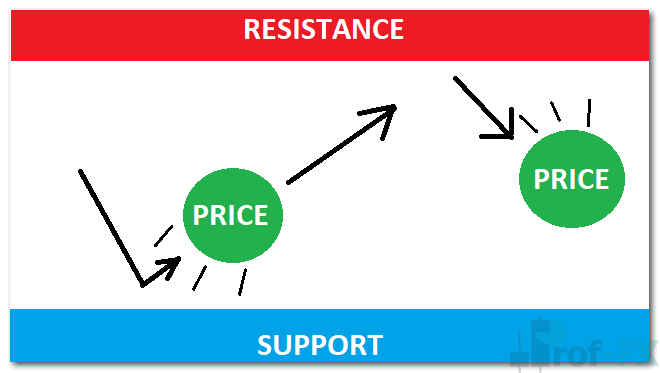
Support is a price area where the market has historically struggled to move lower. When price reaches this zone, selling pressure tends to weaken while buying interest increases, often causing price to rebound upward.
In theory, support represents a level where demand outweighs supply:
- Buyers perceive price as undervalued
- Sellers become less willing to sell at lower prices
As a result, buying pressure absorbs selling pressure, preventing price from falling further—at least temporarily.
From a trading psychology perspective, support reflects collective market memory, where participants recall prior reactions and adjust their behavior accordingly.
Understanding Resistance in Forex Trading
Resistance is the opposite of support. It is a price area where the market has historically struggled to move higher. When price approaches resistance, buying momentum often fades while selling pressure increases.
Resistance forms because:
- Buyers perceive price as expensive
- Sellers see value in locking in profits
In this scenario, supply exceeds demand, preventing price from moving higher. Like support, resistance is not a precise line but a price zone where reactions repeatedly occur.
For a deeper conceptual breakdown, traders can explore our comprehensive guide on Forex Support and Resistance Explained.
Top 4 Support and Resistance Trading Strategies
Below are four of the most practical and commonly used support and resistance trading strategies, explained with real-market logic and trader behavior in mind.
1. Range Trading with Support and Resistance
Range trading occurs when price oscillates between clearly defined support and resistance levels, without forming a strong trend. In these conditions, traders typically:
- Buy near support
- Sell near resistance
Think of the price range as a room:
- Support is the floor
- Resistance is the ceiling
Markets tend to move sideways during periods of uncertainty, low momentum, or consolidation.
Pro Tip:
Support and resistance are rarely exact lines. Price often reacts within zones, not at a single price level.
To apply this strategy, traders must first identify a valid trading range, as shown below.
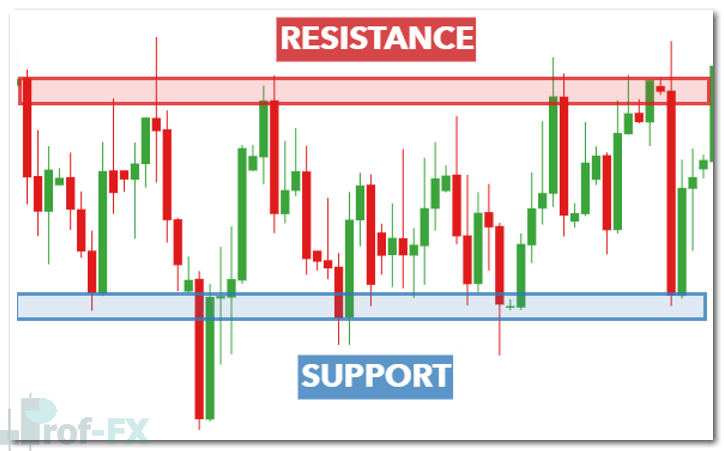
In range-bound conditions:
- Long positions are favored when price reacts bullishly from support
- Short positions are favored when price reacts bearishly from resistance
Because price does not always respect these levels perfectly, traders should place:
- Stops below support for long trades
- Stops above resistance for short trades
When price eventually breaks out of the range, it may result in either a true breakout or a false breakout (fakeout). This is why sound risk management is essential in range trading.
2. Breakout Strategy Using Pullbacks
After extended periods of consolidation or indecision, markets often break out and begin trending. Breakout traders look for price to move above resistance or below support with strong momentum.
However, experienced traders rarely enter immediately on the break. To avoid false breakouts, they wait for a pullback—a temporary retracement back toward the broken level.
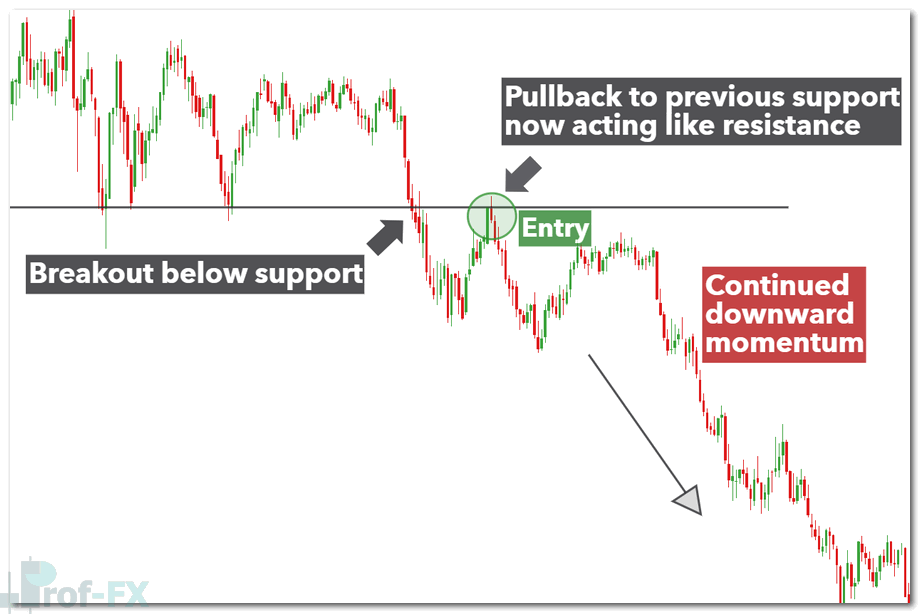
For example, when price breaks below support:
- Many traders rush into short positions
- Professional traders wait to see if former support fails to hold as resistance
In the scenario below, traders wait for the pullback to stall before entering short positions, increasing the probability of success.
This approach allows traders to:
- Confirm market intent
- Reduce emotional entries
- Improve risk-to-reward ratios
3. Trendline Strategy as Dynamic Support and Resistance
The trendline strategy treats trendlines as dynamic support or resistance rather than static horizontal levels.
To draw a trendline:
- Connect two or more higher lows in an uptrend
- Connect two or more lower highs in a downtrend
In strong trends, price often respects these trendlines and continues moving in the direction of the prevailing trend.
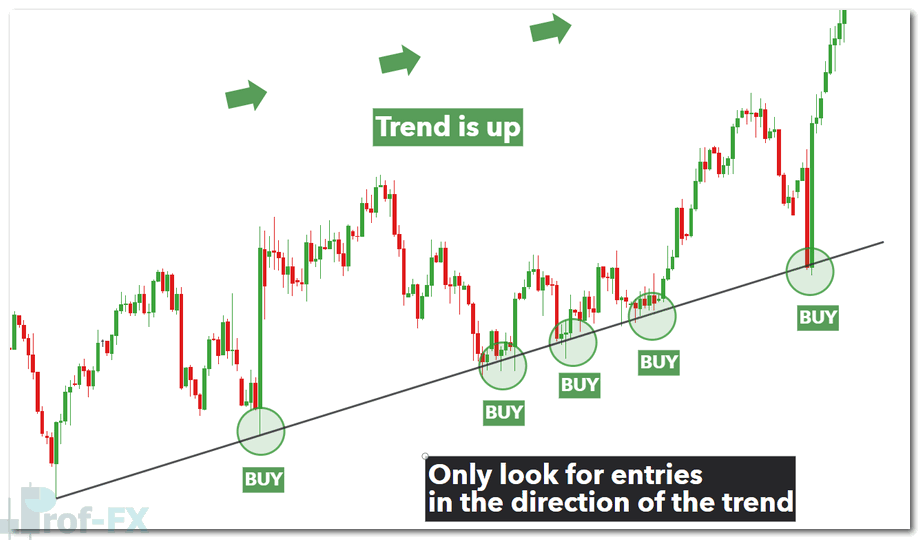
For higher-probability setups, traders should:
- Only look for long trades in uptrends
- Only look for short trades in downtrends
Trading in the direction of the trend aligns with institutional flow and reduces unnecessary counter-trend risk.
4. Using Moving Averages as Support and Resistance
Moving averages (MAs) can act as dynamic support and resistance, adjusting with price over time. Popular settings include:
- 20 and 50 period moving averages
- Fibonacci-based alternatives such as 21 and 55
- Longer-term averages like the 100 and 200 MA
Each trader may prefer different settings depending on their timeframe and strategy.
In the example below, the 55-period moving average initially acts as resistance. After the market bottoms and reverses, the same moving average transitions into dynamic support.
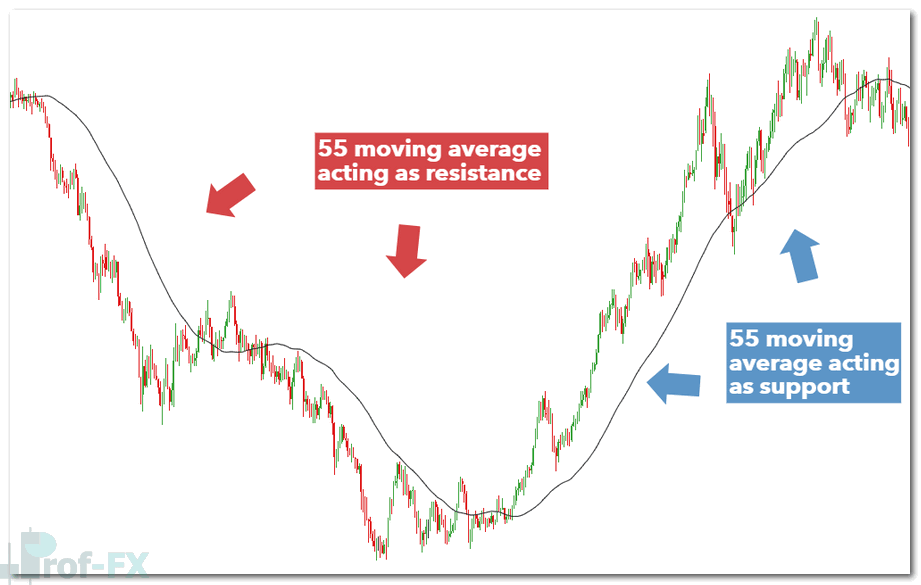
This role reversal helps traders identify:
- Trend continuation opportunities
- Potential breakout or trend failure zones
Moving averages are especially effective when combined with price action and market structure.
Support and Resistance Trading: Key Takeaways
Support and resistance remains one of the most powerful tools in trading because it reflects real market behavior and psychology.
Key points to remember:
- Most trading strategies rely on some form of support and resistance
- Traders can profit from both range-bound markets and breakout conditions
- Support and resistance levels will eventually fail
- Strong risk management is essential to survive breakouts and false signals
Learn More About Technical Analysis in Forex Trading
To further develop your technical trading skills, explore these topics:
- Identifying high-quality support and resistance zones
- Maximizing breakout and pullback strategies
- Practical trendline trading techniques
- Simple methods to spot support and resistance in forex
- Technical analysis versus fundamental analysis
Prof FX provides forex news, educational content, and professional technical analysis focused on the trends and macroeconomic forces that influence the global financial markets.


