
Supply and demand are the fundamental forces that drive price movement in any market. This principle applies universally – from everyday goods at a local farmers’ market to rare collectibles, and especially to the global foreign exchange (forex) market. For forex traders, understanding how supply and demand interact provides a critical framework for analyzing price behavior and anticipating future market movements.
In this guide, I will walk you through the core concepts of supply and demand trading in forex, explain how to identify key zones on your chart, and demonstrate practical strategies that beginner traders can apply with confidence.
This article covers the following key topics:
- Supply and demand trading explained in forex
- How to identify supply and demand zones
- Three practical tips for trading supply and demand
- Proven supply and demand trading strategies
- Risk management using supply and demand zones
What Is Supply and Demand Trading in Forex?
In the forex market, price moves because of an imbalance between buyers and sellers. When buying pressure exceeds selling pressure, price rises. Conversely, when sellers dominate, price falls. Supply and demand trading focuses on identifying price areas where these imbalances have occurred repeatedly in the past.
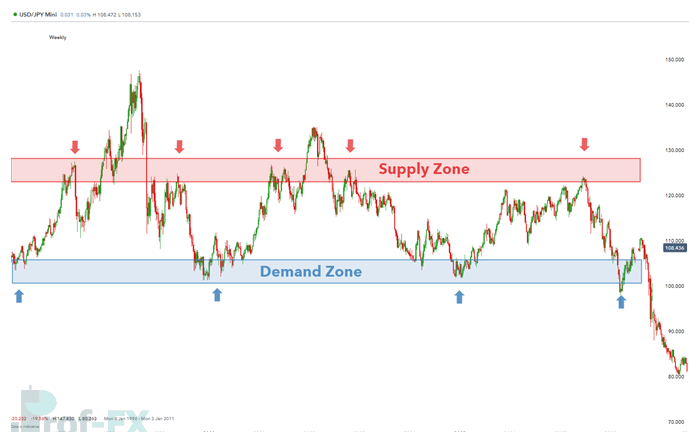
A currency pair often rallies into an area known as a supply zone, sometimes referred to as a selling zone. This is where market participants—particularly institutional traders, banks, and large liquidity providers—believe price is relatively overvalued and selling pressure increases. As a result, price frequently reverses or consolidates at these levels.
On the other hand, when a currency pair declines into a demand zone, buyers perceive value at lower prices. Strong buying interest tends to emerge, causing price to rebound. These zones reflect collective market psychology and the actions of major forex market participants.
For traders who want a stronger foundation, reviewing the economic principles behind supply and demand can significantly enhance market awareness and decision-making.
How to Identify Supply and Demand Zones on a Forex Chart
Supply and demand zones are best understood as price areas, not precise lines. Unlike traditional support and resistance, which are often drawn as single levels, supply and demand zones reflect broader regions where price has reacted multiple times.
These zones become visible when price approaches the same area repeatedly and responds with strong moves away. They highlight where liquidity entered the market aggressively in the past—often driven by institutional order flow.
Most modern trading platforms allow traders to mark these zones visually by drawing rectangular areas over past price reactions.
Three Essential Tips for Trading Supply and Demand in Forex
1. Use Higher Time Frames to Identify Strong Zones
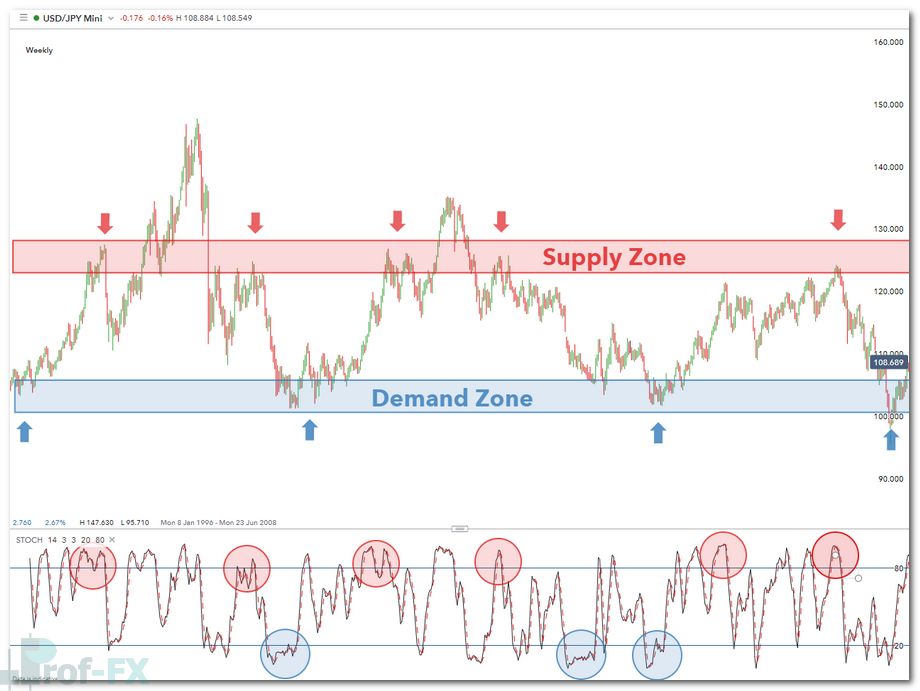
One of the most common mistakes beginner traders make is focusing exclusively on short-term charts. To identify meaningful supply and demand zones, it is essential to analyze higher time frames such as the daily or weekly charts.
By zooming out, you can clearly see areas where price previously reversed with strength. These zones tend to carry more significance because they reflect decisions made by institutional traders rather than short-term retail activity. Once identified, these zones can then be refined on lower time frames for trade entries.
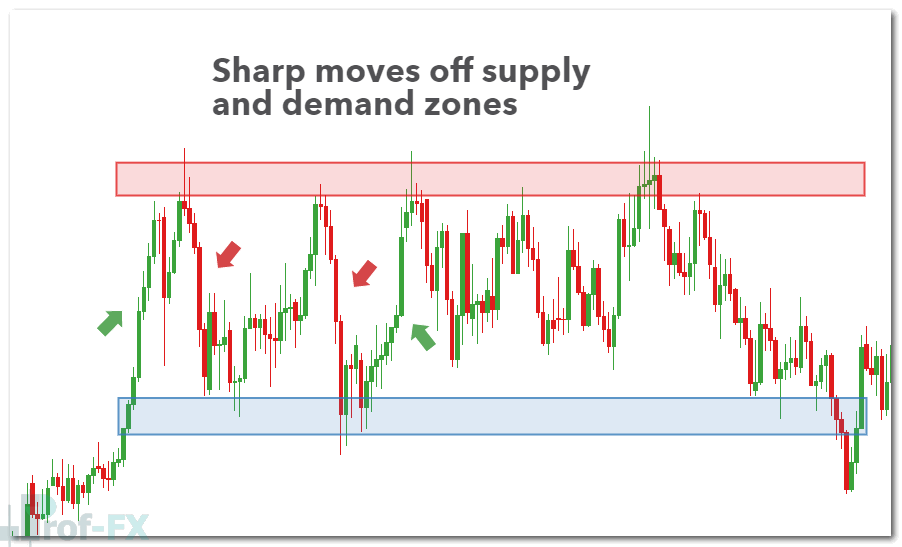
2. Look for Strong Price Reactions from the Zone
Not all zones are created equal. High-quality supply and demand zones are typically followed by strong and impulsive price movements. When price accelerates rapidly away from a zone, it signals aggressive participation from large market players such as banks, hedge funds, or asset managers.
If price repeatedly shows sharp moves from the same level, the probability increases that this area represents genuine supply or demand. These are the zones traders should prioritize.
3. Use Technical Indicators for Confirmation
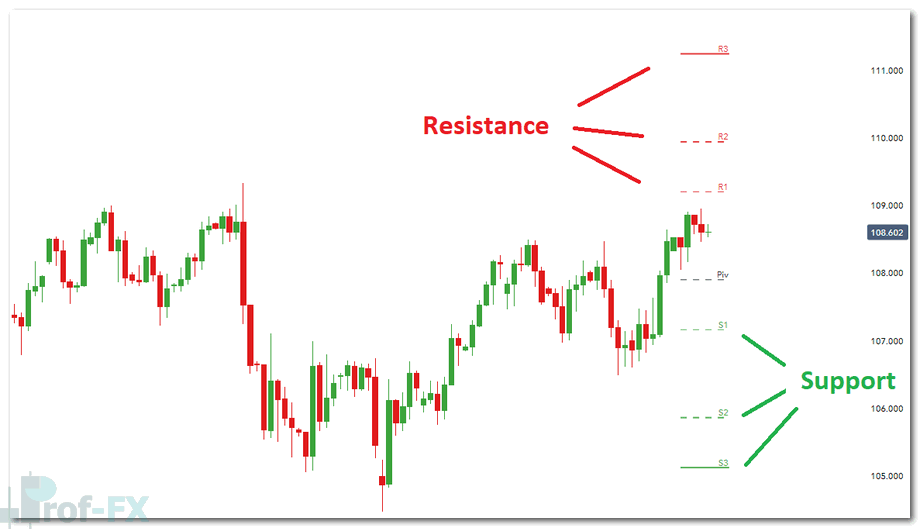
While supply and demand zones can stand on their own, combining them with technical tools can improve trade accuracy. Pivot points—especially daily and weekly levels—are commonly used by professional traders to validate key price areas.
At Prof FX, traders can access updated support and resistance levels across major forex pairs. When these levels align with supply or demand zones, it strengthens the overall trading bias.
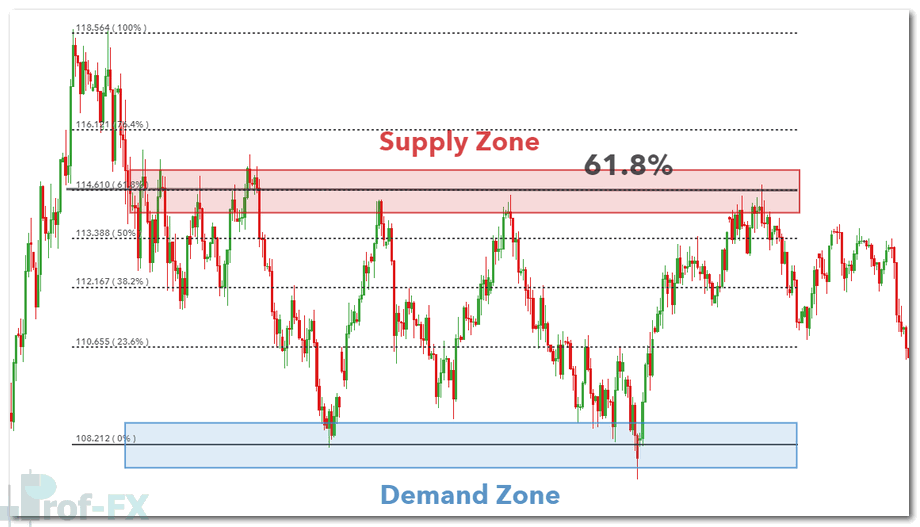
Additionally, Fibonacci retracement levels can enhance precision. The 61.8% Fibonacci level, often referred to as the “golden ratio,” is widely respected by institutional traders and frequently aligns with key turning points within supply or demand zones.
Practical Supply and Demand Trading Strategies
Range Trading Using Supply and Demand Zones
When supply and demand zones are clearly defined and price is moving sideways, range trading becomes a viable strategy. In this scenario, traders look to sell near supply zones and buy near demand zones.
Momentum indicators such as the RSI (Relative Strength Index) or Stochastic Oscillator can help identify overbought and oversold conditions within the range. After spotting these conditions on a higher time frame, traders can drop down to a lower time frame to fine-tune their entries.
This approach allows both long and short trades, provided market conditions remain non-directional.
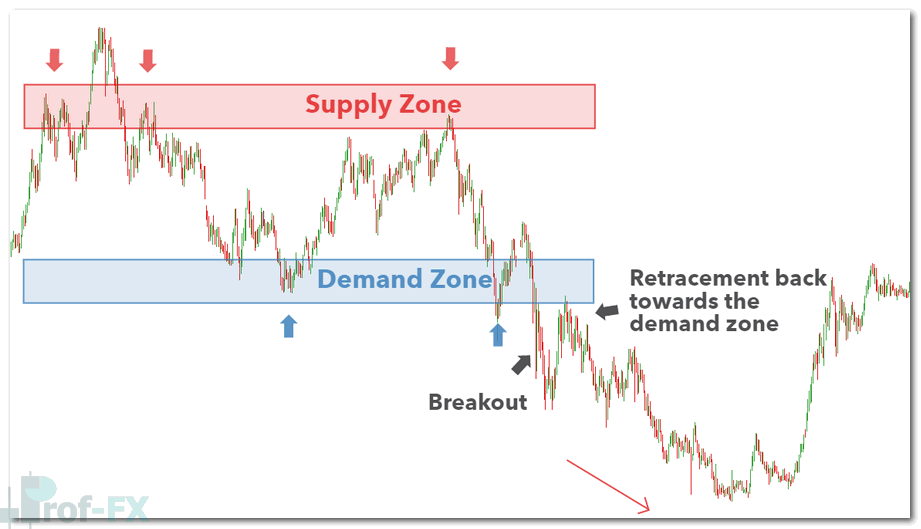
Breakout Trading with Supply and Demand
Markets do not remain in ranges indefinitely. Eventually, price breaks out as new information, economic data, or shifts in market sentiment enter the system.
In breakout trading, the goal is to enter in the direction of the breakout while managing risk carefully. However, false breakouts are common. Price often breaks a range and then retraces back toward the original supply or demand zone.
For example, on the USD/JPY chart, price may break below a range before retracing into a demand zone. Traders who enter too early risk being stopped out. A more conservative approach is to wait for the retracement toward the zone before executing the trade.
Using Supply and Demand Zones for Risk Management
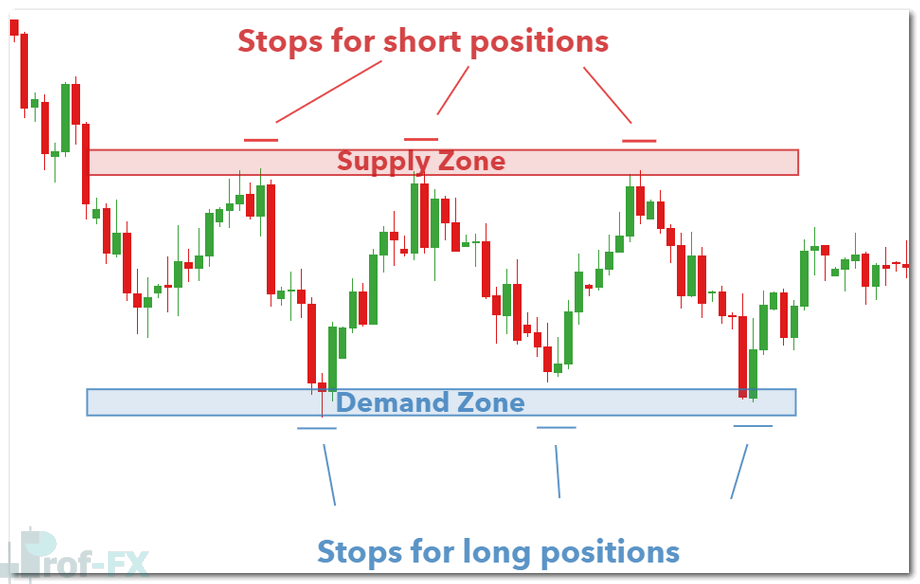
Supply and demand zones are highly effective for defining stop-loss and take-profit levels. Because these zones function similarly to support and resistance, they provide logical reference points for managing risk.
For example:
- Traders selling at a supply zone can place stop-loss orders just above the zone.
- Profit targets can be set near the opposing demand zone.
- Conservative traders may choose partial exits or trailing stops to lock in gains.
This structured approach allows traders to maintain a positive risk-to-reward ratio, which is essential for long-term success in forex trading.
The USD/SGD chart below demonstrates how supply and demand zones can be used to place stops and limits effectively.
Supply and Demand vs Support and Resistance
While supply and demand zones share similarities with support and resistance, they emphasize order flow and institutional behavior rather than static price levels. Understanding the distinction can help traders align more closely with how professional market participants operate.
Further Learning: Supply and Demand in Forex Trading
Supply and demand zones are the result of underlying economic forces and trader behavior. To improve your ability to identify these zones accurately, it is essential to understand the fundamentals of supply and demand theory.
At Prof FX, we provide up-to-date support and resistance levels across major forex markets. For traders at the beginning of their journey, downloading a comprehensive beginner’s forex trading guide can accelerate learning and build a solid foundation.


