
The rising wedge is a well-known reversal pattern often used by traders to predict future price movements. It provides insight into the potential direction and distance of a price shift, making it a valuable tool in a trader’s arsenal.
Rising wedge patterns frequently appear in financial markets, and their simplicity makes them appealing for both identification and practical use. This guide will walk you through spotting a rising wedge on forex charts and demonstrate how to trade this powerful pattern.
Learn to Trade the Rising Wedge
Understanding how to effectively trade using the rising wedge requires familiarity with its characteristics and implications. Let’s break it down step-by-step:
What is a Rising Wedge Pattern?
A rising wedge pattern, also called an ascending wedge, is a strong consolidation pattern seen when price action is constrained between two rising trend lines. This pattern generally signals a bearish market sentiment and can indicate both reversal and continuation patterns, depending on its position within a trend. Regardless of its context, the rising wedge is inherently bearish, offering traders an early clue that the price might reverse or weaken soon.

In contrast, the falling wedge pattern slopes downward between converging trend lines, signaling a bullish sentiment. The falling wedge is a reversal pattern, often indicating that a downtrend may soon reverse into an uptrend.
How to Identify a Rising Wedge Pattern on Forex Charts
The rising wedge can be recognized as either a bearish continuation or reversal pattern. These two scenarios create some confusion, as they carry different sets of dynamics. However, they can both be traded successfully if you know how to spot the pattern and use supporting indicators.
Continuation Pattern:
- Forms during an downtrend.
- The wedge consolidates, forming higher highs and lower lows that converge toward a narrowing point.
- Use a trend line to connect these highs and lows.
- Divergence between price and volume is a critical sign; tools like MACD or volume indicators can help confirm this.
- Look for overbought signals from technical indicators like oscillators.
- A break below the wedge’s support signals a potential short trade entry.
Reversal Pattern:
- Forms during an uptrend.
- Similar consolidation of price with the wedge forming higher highs and lower lows.
- As with the continuation pattern, divergence between price and volume is key.
- Overbought indicators like oscillators strengthen the case for a reversal.
- Once support is broken, this confirms the reversal, signaling an opportunity to enter a short trade.
How to Trade the Rising Wedge Pattern
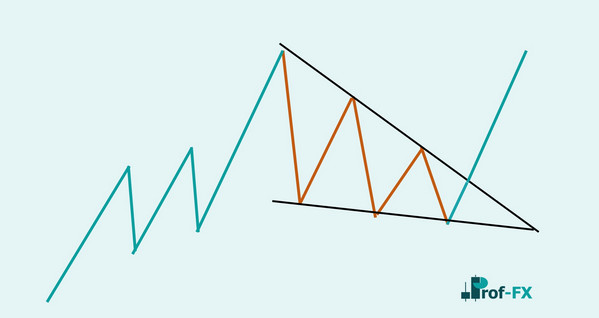
Trading the rising wedge involves understanding when to expect a continuation or a reversal. Below is an example showing a continuation of a downtrend after the formation of a rising wedge.
EUR/USD rising wedge forex chart pattern:

The chart example highlights a downtrend followed by a rising wedge consolidation. The blue lines mark the wedge boundaries, showing weakening bullish strength. Divergence between the diminishing volume and rising price indicates the uptrend is losing steam.
Once the price breaks the support trend line, the opportunity to enter a short position arises. There are two ways to approach this entry:
- Wait for a candle to close below the support trend line for confirmation before entering.
- Enter immediately once the price breaks below the support line, without waiting for a candle close.
To set a stop level, traders often use the highest point of the rising wedge, which aligns with the resistance trend line. This approach offers simplicity for new traders to define their stop-loss level. The limit or take-profit target can be set at the previous swing low, providing a favorable risk-to-reward ratio.
Advantages and Disadvantages of the Rising Wedge
Advantages:
- Simplicity in Identification: The rising wedge is visually straightforward, making it easy for traders to recognize the pattern on their charts.
- Clear Entry and Exit Points: The break below support provides clear entry signals, and the high point of the wedge gives an obvious stop-loss level.
- Versatile in Market Conditions: It can indicate both reversals and continuations, making it applicable in different market scenarios.
Disadvantages:
- False Breakouts: The rising wedge can sometimes produce false breakouts, leading to premature trade entries.
- Requires Confirmation: Additional indicators such as volume or oscillators are often necessary to confirm the pattern’s validity.
- Short-Lived Opportunities: Since the pattern typically signals trend exhaustion, price movements following the wedge may not be sustained for long.
Further Reading on Forex Trading Patterns
To enhance your trading skills, consider exploring other chart patterns like the head and shoulders, double top, or double bottom, all of which can improve your ability to recognize profitable trading setups.
If you’re new to forex trading, it’s essential to master the basics. Check out our beginner’s guide to forex trading to get started on the right foot.
For more detailed strategies, dive into our comprehensive list of top forex trading techniques and discover the approach that best suits your trading style.


