
Understanding long wick candles is an essential skill for forex traders who want to read market intent more clearly. These candles appear frequently across all timeframes and currency pairs, yet many traders overlook them due to their apparent simplicity. In reality, long wicks often reveal who is in control of the market—buyers or sellers – during a specific period.
When interpreted correctly and combined with price action, trend analysis, and key technical levels, long wick candles can provide high-quality trading signals, particularly around support and resistance.
In this article, I will explain long wick candles as if presenting this concept to beginner traders, focusing on clarity, structure, and real trading logic.
This guide covers:
- What long wick candles are
- How to identify long wick candles on forex charts
- What long wicks tell us about market behavior
- How traders can apply long wicks in real trading scenarios
- Advantages and limitations of using long wick candles
Why Long Wick Candles Matter in Forex Trading
The forex market is driven by constant interaction between buyers (bulls) and sellers (bears). Long wick candles visually capture this struggle within a single candle, offering traders insight into rejection, pressure, and potential reversals.
While long wick trading is often viewed as basic, professional traders value it because it reflects raw price behavior, free from indicator lag.
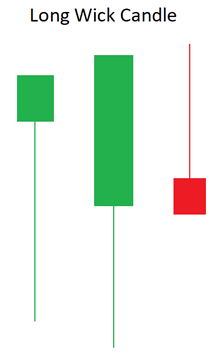
What Are Long Wick Candles?
A long wick candle is a type of candlestick where the wick (also called the shadow) is significantly longer than the candle body. The body itself can be either bullish or bearish, which means long wicks can appear on any candlestick type.
The wick represents how far price traveled during a given time period before being rejected. A long wick therefore highlights areas where the market attempted to move higher or lower but failed to sustain those levels.
For forex traders, these failed attempts often signal:
- Strong buying or selling pressure
- Rejection at key price levels
- Potential market turning points
Example of long wick candles on a forex chart:
How to Identify Long Wick Candles on Forex Charts
Identifying long wick candles is straightforward, but proper interpretation requires context. Traders should follow a structured approach:
First, look for candles with wicks that are disproportionately longer than those of surrounding candles. These stand out visually and often mark important price reactions.
Second, apply price action analysis to determine whether the long wick aligns with a meaningful level such as:
- Horizontal support or resistance
- Trendlines
- Fibonacci retracement levels
Finally, assess whether multiple long wicks appear near the same level, which strengthens the significance of that price zone.
Identifying long wick candles near key levels:
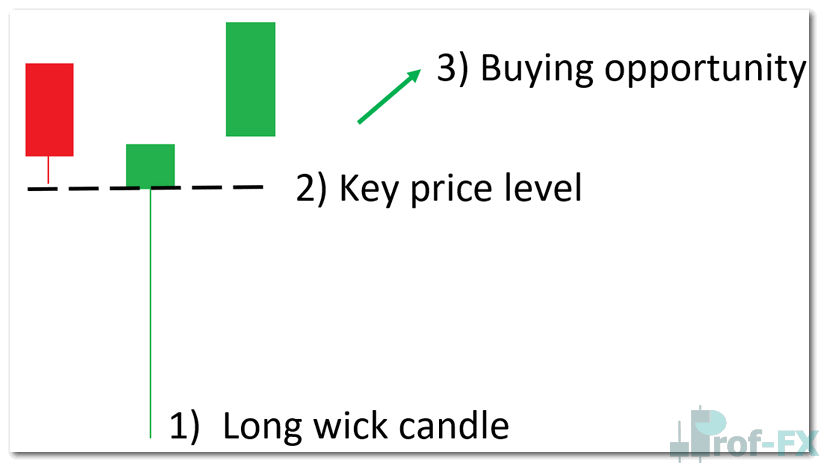
Long wicks become far more powerful when they appear at levels already respected by the market.
What Does a Long Wick Indicate in Forex Trading?
Long wick candles belong to a broader family of reversal candlestick patterns, including hammers, shooting stars, and gravestone Doji candles. Each of these patterns reflects price rejection.
Let’s examine how this works in practice.
NZD/JPY Example: Long Wick Candles and Reversal Signals
In the weekly NZD/JPY chart below, several long wick candles appear just before a notable shift in price direction. These wicks, highlighted in blue, offer valuable clues about market sentiment.
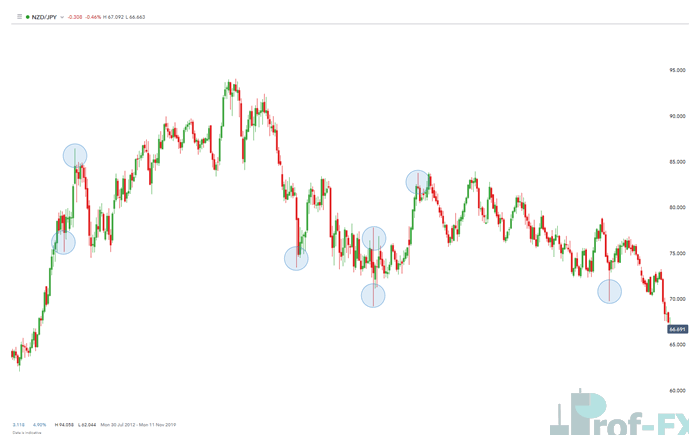
When a candle forms with a long lower wick, it shows that sellers initially pushed price lower. However, buyers stepped in aggressively and forced price back up before the candle closed. This behavior indicates buyer strength and suggests that downward momentum may be weakening.
Conversely, when a candle forms with a long upper wick, it signals that buyers attempted to push price higher but were overpowered by sellers. This rejection often precedes downward movement.
The key takeaway is that long wicks expose failed attempts by one side of the market, giving traders early insight into potential reversals or continuation moves.
How Traders Can Use Long Wick Candles in Their Strategy
To use long wick candles effectively, traders must first identify the overall market trend. This step is critical.
In a downtrend, long upper wicks signal that sellers are defending higher prices. If price retraces upward and stalls near resistance, long wicks at the top of candles suggest the trend is likely to resume lower.
In an uptrend, long lower wicks near support indicate buyer defense and potential continuation higher.
Consider a downtrend scenario:
- Price retraces against the trend
- The retracement stalls at resistance or a Fibonacci level
- Multiple candles form with long upper wicks
These wicks suggest sellers are rejecting higher prices, providing traders with:
- A directional bias aligned with the trend
- A logical area for trade entries
- A precise reference point for stop-loss placement
The top of the long wick becomes a prudent stop level because price has already failed to move beyond that point. This approach improves risk management and reduces unnecessary stop-outs.
Which Timeframes Are Best for Trading Long Wicks?
Long wick candles can be applied across multiple timeframes, depending on a trader’s style:
- Day traders may focus on 5-minute or 10-minute charts
- Intraday traders often use 1-hour, 2-hour, or 4-hour charts
- Swing traders typically rely on daily or weekly charts
While long wicks appear on all timeframes, higher timeframes generally produce more reliable signals due to reduced market noise.
Advantages and Limitations of Long Wick Candles
Like all trading concepts, long wick candles have both strengths and weaknesses.
Advantages
- Appear frequently across all financial markets
- Easy to identify visually
- Provide insight into buyer and seller behavior
- Effective when combined with trend and key price levels
Limitations
- Should not be traded in isolation
- Require confirmation from price structure or indicators
- Can generate false signals in low-liquidity conditions
Further Learning on Forex Candlestick Patterns
To deepen your understanding of price action trading, it is recommended to explore other well-known candlestick and chart patterns, including:
- Rising wedge and falling wedge patterns
- Head and shoulders formations
- Double top and double bottom structures
- Inside bar setups
You may also benefit from reviewing a complete guide on how to read candlestick charts, which reinforces the foundational principles behind candlestick analysis.
When long wick candles form at key levels and align with the dominant trend, they can provide traders with a meaningful edge—one built on understanding market behavior rather than relying solely on indicators.


