Synopsis E-book: Candlestick Patterns for Day Trading
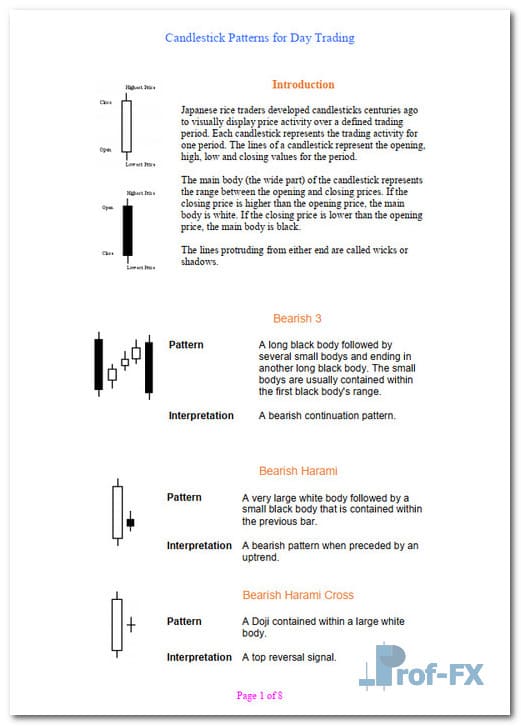
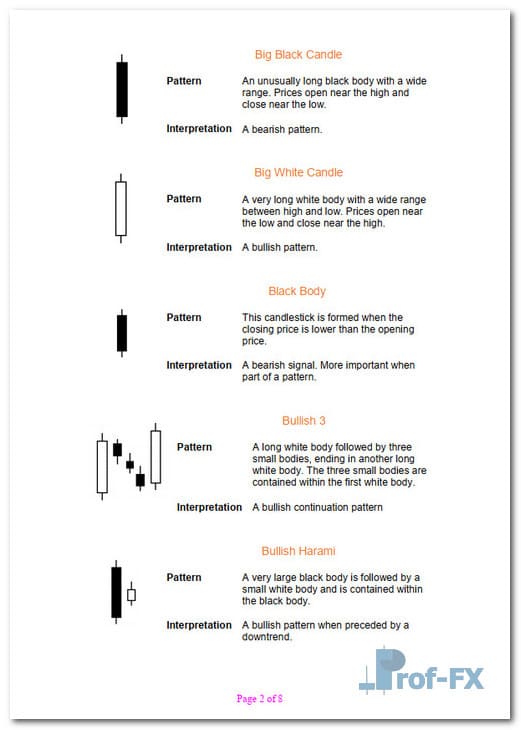
Japanese rice traders developed candlesticks centuries ago to visually display price activity over a defined trading period. Each candlestick represents the trading activity for one period. The lines of a candlestick represent the opening, high, low and closing values for the period.
The main body (the wide part) of the candlestick represents the range between the opening and closing prices. If the closing price is higher than the opening price, the main body is white. If the closing price is lower than the opening price, the main body is black.
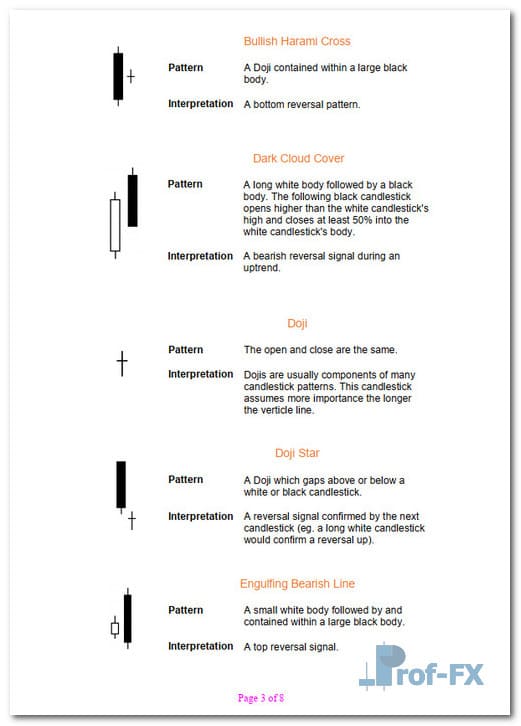
Preview Candlestick Patterns for Day Trading
 |
 |
 |
Download E-book Candlestick Patterns for Day Trading
- Candlestick-Patterns-for-Day-Trading.pdf
- Size: 46.2 kb
- Author: Mark Crisp | Language: English | Dir.: Part1 | Request Remove!
https://www.prof-fx.com/assets/ebook/Part1/Candlestick-Patterns-for-Day-Trading.pdf