
What is a 200 Day Moving Average?
The 200-day moving average (MA) is a technical indicator that helps traders identify and analyze long-term market trends. Essentially, it represents the average closing price of a security over the last 200 days, forming a line on a chart that reflects the overall direction of the market. This indicator can be applied to any financial instrument, including forex market.
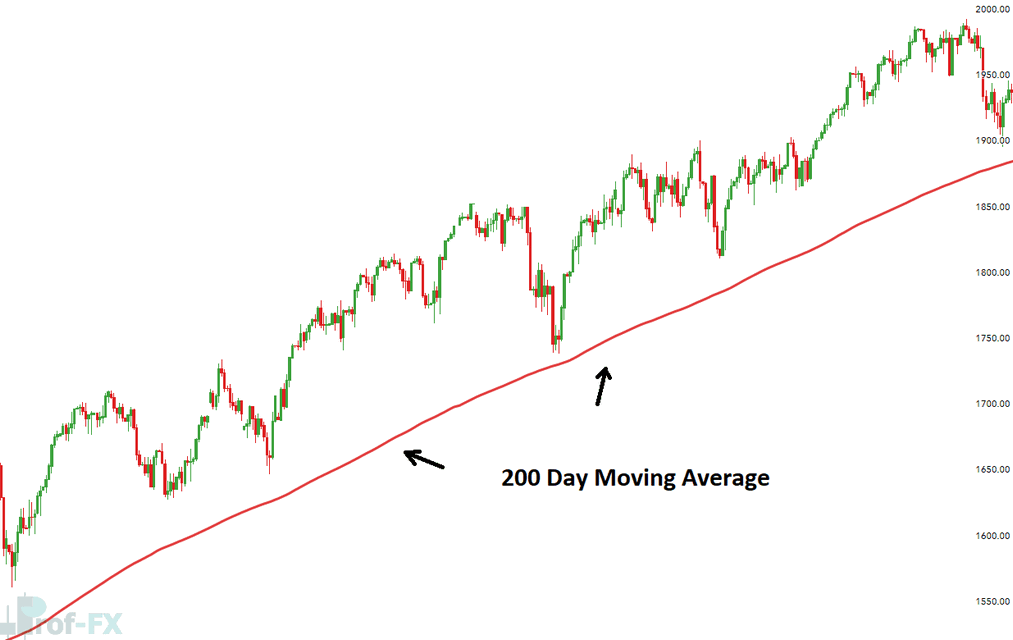
Forex traders heavily rely on the 200-day moving average due to its reliability in signaling long-term trends. When the price consistently trades above the 200-day MA, the market is generally considered to be in an upward trend. Conversely, when the price stays below the 200-day MA, the market is seen as trending downward.
How Do You Calculate the 200 Day Moving Average?
Calculating the 200-day moving average is straightforward. You simply add up the closing prices of the past 200 days and then divide the total by 200 to get the average.
200-Day Moving Average Formula:
200 Day Moving Average Formula = [(Day 1 + Day 2 …. + Day 200)/200]
As each new day passes, a new data point is added, forming a continuous line that represents the 200-day moving average when plotted on a chart.
How Do You Use the 200-Day Moving Average in Your Trading Strategy?
The 200-day moving average is widely used because it serves multiple functions in a trader’s strategy. Let’s explore some of the key ways it can be utilized.
Using the 200-Day MA as Support and Resistance
One common use of the 200-day moving average is to identify important levels of support and resistance. In many cases, the price tends to respect the 200-day MA, either bouncing off it and continuing along the existing trend or breaking through it to signal a potential reversal. This makes the 200-day moving average a dynamic level of support or resistance.
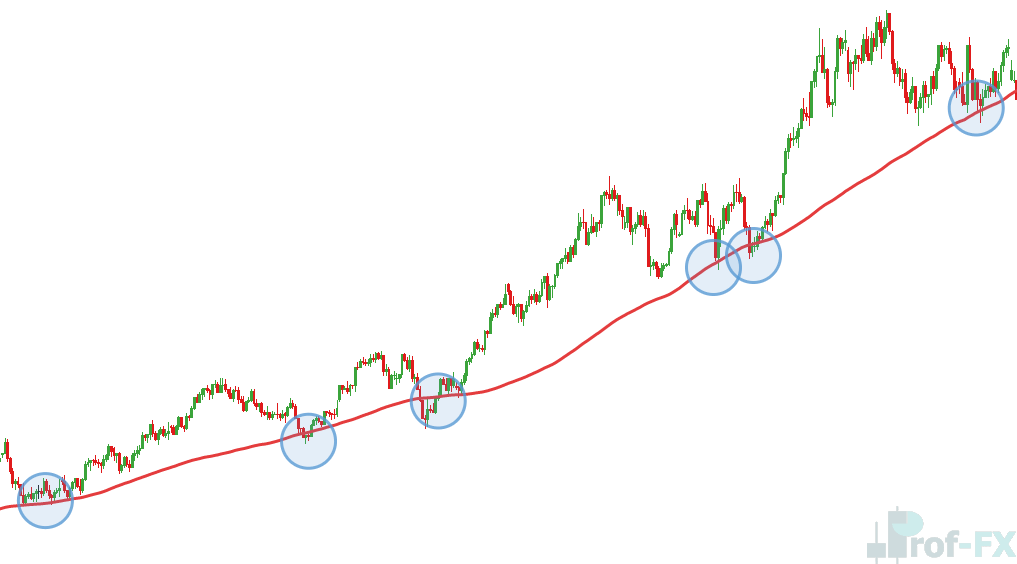
For instance, in an upward trend, when the price approaches and bounces off the 200-day MA, traders may consider going long (buying). On the flip side, in a downtrend, if the price touches and rebounds from the 200-day MA, traders might look for short (sell) opportunities. A stop loss can be set just below the moving average in an uptrend or above it in a downtrend.
MA Crossovers
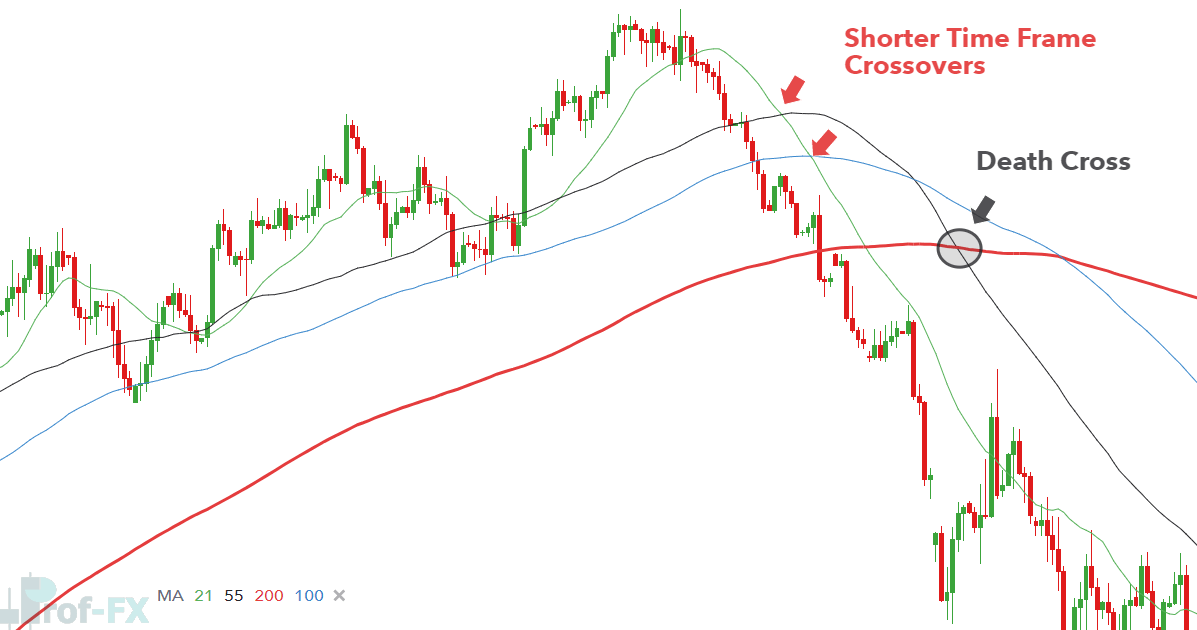
After identifying the long-term trend with the 200-day MA, traders often look to assess its strength. A weakening trend might indicate a potential reversal, signaling it’s time to exit or adjust existing positions.
Shorter-term moving averages, such as the 21-day, 55-day, or 100-day MAs, can help in this analysis. Since these shorter MA’s track more recent price movements, they offer early signs of weakening momentum. For example, if the 21-day MA crosses below the 55-day and then continues to break the 100-day and 200-day MAs, it indicates that the trend could be shifting from bullish to bearish.
Using the 200-Day Moving Average as a Trend Filter
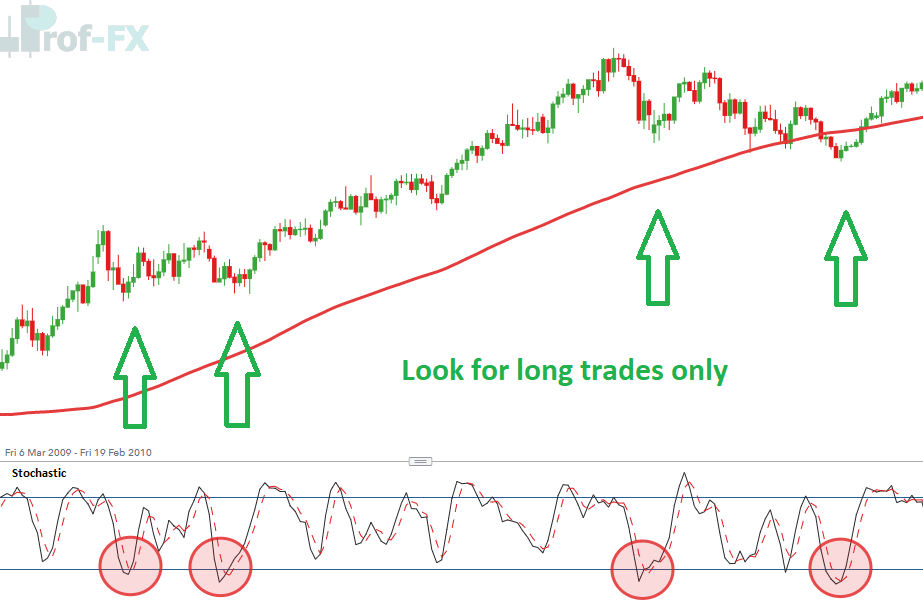
One simple yet effective strategy involves using the 200-day moving average to filter trades in the direction of the prevailing trend. Traders will only take trades that align with the general market direction as indicated by the 200-day MA.
For example, if a forex pair like NZD/USD trades consistently above the 200-day moving average, traders may only seek long (buy) positions. They often combine the 200-day MA with other indicators, such as the stochastic oscillator, or rely on different entry criteria based on personal preference.
200 Day Moving Average Indicator: A Summary
The 200-day moving average is a powerful and widely used tool for identifying the long-term trend in any market. Due to its widespread use, it often acts as a self-fulfilling prophecy, with price action responding to this key indicator in expected ways.
Many traders use the 200-day MA to align their trades with the broader trend and take advantage of price bounces off this key level. Whether you’re a beginner or an experienced trader, understanding how to utilize this indicator effectively can significantly improve your strategy.
Conclusion
The 200-day moving average is just one of many useful technical indicators. To broaden your knowledge, check out our comprehensive article on popular indicators. If you’re new to forex, consider starting with our free guide that covers the basics of forex trading.
Moving averages like the 200-day MA are trend-following indicators. Other indicators, such as the Ichimoku Cloud and Average Directional Index, can also be used to identify trends, as well as traditional trendlines for those who prefer a more manual approach.


