
Candlestick patterns are among the most powerful and widely used tools in technical analysis. For forex traders—especially beginners—learning how to read candlestick patterns provides a structured way to interpret market psychology, anticipate potential trend changes, and improve trade timing.
In this guide, I will explain what candlestick patterns are, how they signal bullish or bearish market behavior, and introduce the top 10 candlestick formations every trader should know. The focus is practical and educational, helping you understand why these patterns work, not just how they look on a chart.
What Are Candlestick Patterns?
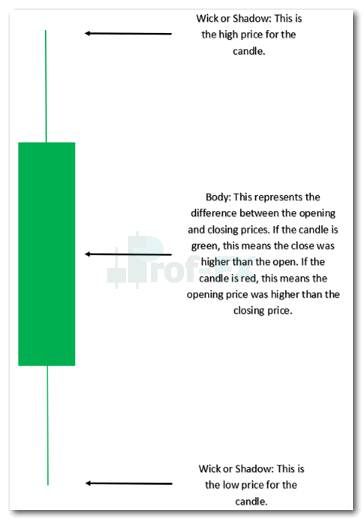
A candlestick is a single price bar that represents the price movement of a financial asset—such as a forex pair—over a specific time period. Each candlestick displays four key pieces of information:
- Open: the price at the beginning of the period
- High: the highest price reached
- Low: the lowest price reached
- Close: the price at the end of the period
Together, these elements form the candlestick’s body and wicks, which visually express the balance between buyers (bulls) and sellers (bears).
Candlestick patterns consist of one or more candlesticks arranged in a way that reveals shifts in market sentiment, momentum, and control. Traders use these patterns to form logical inferences about future price movement, particularly when combined with trend analysis, support and resistance, or supply and demand zones.
If you are new to this concept, understanding how to read candlestick charts is a critical first step before applying patterns in live trading.
Bullish vs Bearish Candlestick Patterns
Candlestick patterns generally fall into two broad categories: bullish and bearish. Each category reflects whether buying or selling pressure is likely to dominate after the pattern forms.
Bullish Candlestick Patterns
| Candlestick Pattern | Market Implication |
| Morning Star | Bullish reversal |
| Bullish Engulfing | Bullish reversal |
| Doji | Bullish/Bearish indecision |
| Hammer | Bullish reversal |
| Bullish Harami | Bullish reversal |
| Piercing Pattern | Bullish reversal |
| Inside Bars | Bullish continuation |
| Long Wicks | Bullish/Bearish reversal |
Bearish Candlestick Patterns
| Candlestick Pattern | Market Implication |
| Evening Star | Bearish reversal |
| Bearish Engulfing | Bearish reversal |
| Doji | Bearish/Bullish indecision |
| Bearish Harami | Bearish reversal |
| Dark Cloud Cover | Bearish reversal |
| Inside Bars | Bearish/Bullish continuation |
| Long Wicks | Bearish/Bullish reversal |
| Shooting Star | Bearish reversal |
Understanding whether a pattern suggests reversal, continuation, or indecision is essential before incorporating it into a trading strategy.
Top 10 Candlestick Patterns Traders Should Know
1) Evening Star and Morning Star
The Morning Star and Evening Star patterns are classic three-candle reversal formations that appear at the end of downtrends and uptrends respectively.
- The first candle follows the existing trend
- The second candle has a small body, signaling indecision
- The third candle confirms the reversal by closing beyond the midpoint of the first candle
A Morning Star suggests a shift from bearish to bullish control, while an Evening Star signals the opposite.
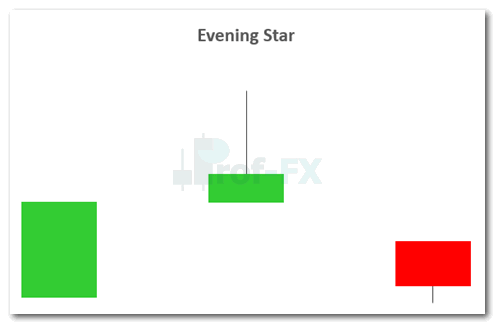
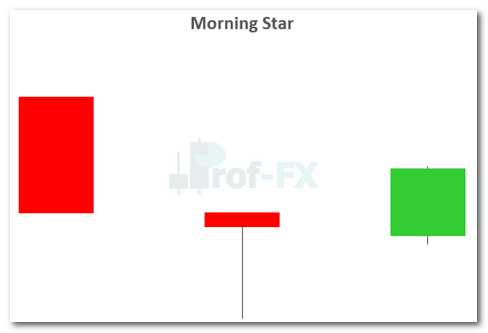
Professional traders typically wait for confirmation—such as a strong follow-through candle—to validate the reversal.
2) Bullish and Bearish Engulfing
The Engulfing pattern is one of the clearest expressions of shifting market control.
- A Bullish Engulfing pattern occurs when a large bullish candle completely engulfs the previous bearish candle
- A Bearish Engulfing pattern forms when a strong bearish candle fully covers the prior bullish candle
These patterns indicate a sudden and decisive change in momentum, often driven by institutional participation.
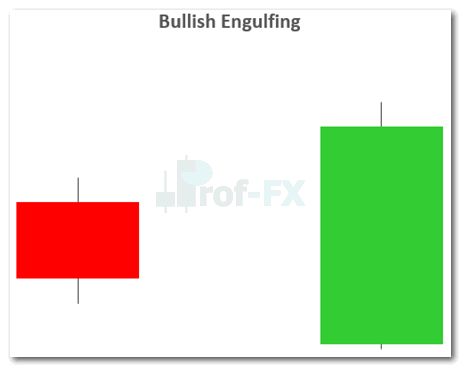
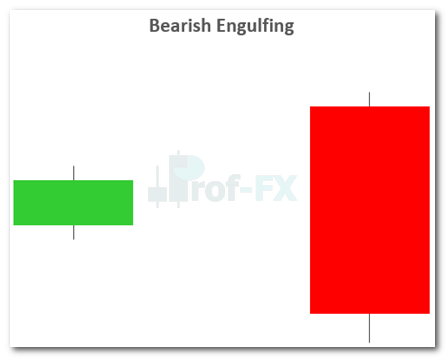
Engulfing patterns are especially effective when they form near key support or resistance levels.
3) Doji
The Doji candlestick represents market indecision. It forms when the opening and closing prices are nearly identical, resulting in a very small real body with long wicks above and below.
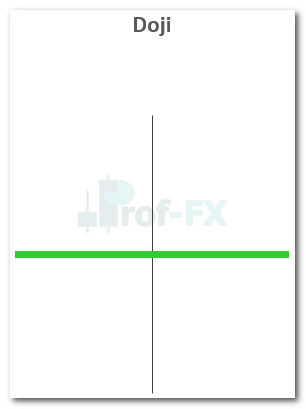
A Doji can appear:
- At the top of an uptrend
- At the bottom of a downtrend
- Midway through a trend
On its own, a Doji does not signal direction—but it often warns traders that momentum is weakening, making it a valuable early warning sign.
4) Hammer
The Hammer is a bullish reversal candlestick that typically forms at the bottom of a downtrend.
Key characteristics:
- Small real body near the top of the candle
- Long lower wick (at least twice the body length)
- Little or no upper wick
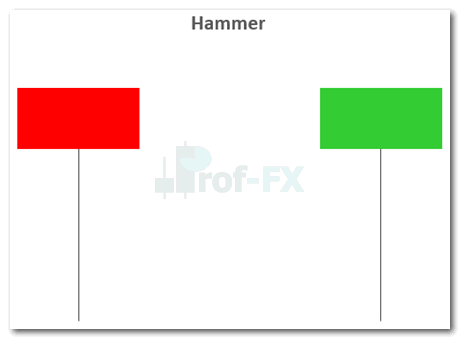
The long lower wick indicates that sellers pushed price lower, but buyers stepped in aggressively—often signaling demand entering the market.
5) Bullish and Bearish Harami
The Harami pattern consists of two candles, where the second candle’s body is fully contained within the first.
- Bullish Harami: Forms after a downtrend
- Bearish Harami: Forms after an uptrend
The term Harami means “pregnant” in Japanese, reflecting the visual structure of the pattern.
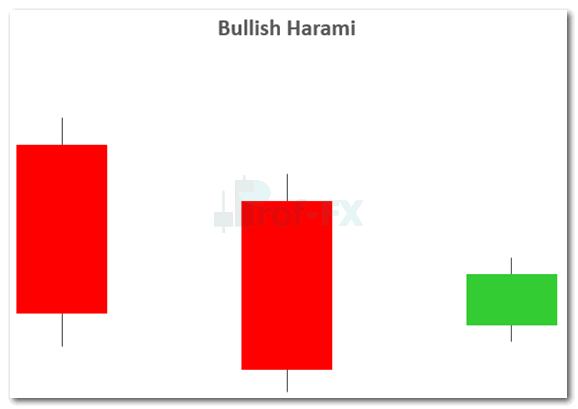
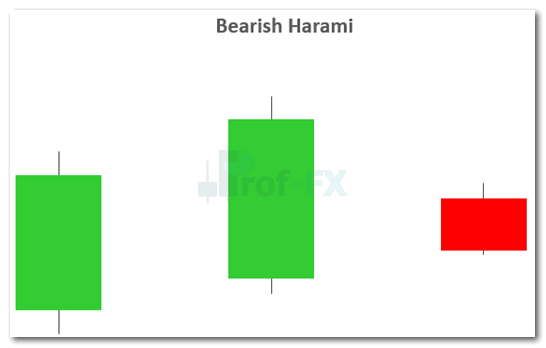
Harami patterns suggest slowing momentum and potential reversal, particularly at important technical levels.
6) Dark Cloud Cover
The Dark Cloud Cover is a bearish reversal pattern that appears after an uptrend.
To be valid:
- The bearish candle must open above the previous bullish close
- It must close below the midpoint of the prior bullish candle
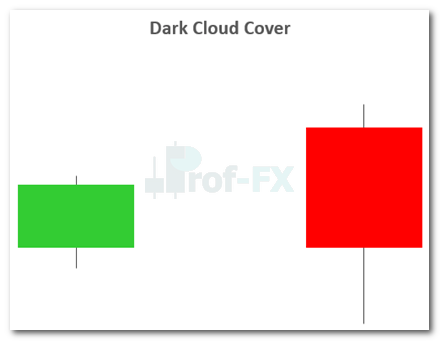
This pattern signals that sellers are regaining control, often preceding deeper pullbacks or trend reversals.
7) Piercing Pattern
The Piercing Pattern is the bullish counterpart to the Dark Cloud Cover and forms after a downtrend.
- First candle: strong bearish
- Second candle: bullish, closing above the midpoint of the first candle
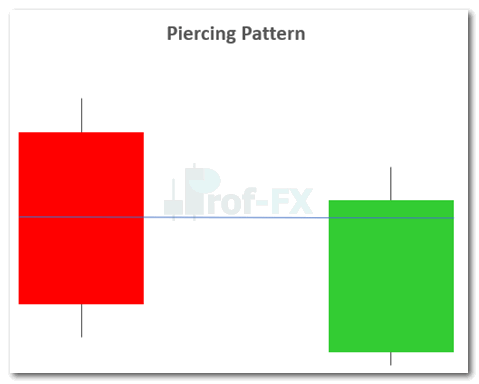
This pattern reflects renewed buying pressure, especially effective near support or demand zones.
8) Inside Bars
An Inside Bar occurs when a candle’s high and low are fully contained within the previous candle, known as the mother bar.
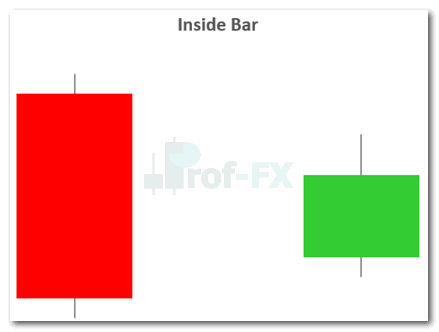
Inside Bars often signal consolidation before continuation, particularly in trending markets. Traders usually place entries above or below the mother bar, trading in the direction of the prevailing trend.
9) Long Wicks
Long Wick candlesticks reveal price rejection. When price probes higher or lower levels and is quickly rejected, it leaves behind a long wick.
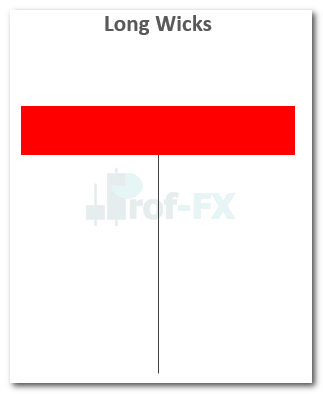
These patterns are most meaningful when they appear:
- At key support or resistance
- After extended trends
- Near supply or demand zones
They often precede short-term or major reversals.
10) Shooting Star
The Shooting Star is a bearish reversal candlestick that forms after an uptrend.
Characteristics include:
- Small real body near the candle’s low
- Long upper wick
- Little or no lower wick
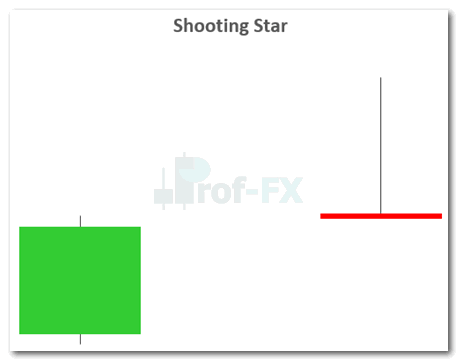
This pattern suggests buyers attempted to push price higher but were overwhelmed by sellers, signaling potential downside movement.
Final Tips for Trading Candlestick Patterns Effectively
Candlestick patterns are most powerful when:
- Used in context, not in isolation
- Combined with trend analysis, support and resistance, and risk management
- Confirmed by follow-through price action
For developing traders, mastering the basics of candlestick charts is essential before relying on advanced formations.
Continue Learning
- Learn the fundamentals with a guide on how to read candlestick charts
- Explore deeper applications in candlestick-based forex trading strategies
Candlestick patterns don’t predict the future—but when used correctly, they offer traders a clear window into market behavior and sentiment, which is exactly what successful trading is built upon.


