 Explained")
Moving Average in Trading: Core Concepts Every Trader Should Know
The Moving Average (MA) is one of the most widely used tools in technical analysis, especially among forex, stock, and CFD traders. Its popularity comes from its simplicity and effectiveness in helping traders identify market trends, momentum, and potential entry and exit levels.
In this guide, I will explain moving averages step by step—from what they are and how they are calculated, to how professional traders interpret them in real market conditions. The goal is to help beginner traders understand not just how to use moving averages, but why they matter.
What Is a Moving Average in Technical Analysis?
In technical analysis, a moving average is an indicator that displays the average closing price of a market over a specific number of periods. By smoothing out short-term price fluctuations, moving averages allow traders to focus on the broader direction of the market rather than reacting to every price spike or pullback.
Because of this smoothing effect, moving averages are commonly used to assess trend direction, market momentum, and overall price behavior. They are especially useful in trending markets such as major forex pairs like EUR/USD, GBP/USD, and USD/JPY.
The two most commonly used moving averages are:
- Simple Moving Average (SMA)
- Exponential Moving Average (EMA)
While both measure average price, the key difference lies in how much importance they give to recent price data.
Simple Moving Average (SMA) vs Exponential Moving Average (EMA)
The Simple Moving Average (SMA) treats all price data equally. Every closing price in the selected period has the same weight, which can sometimes cause the indicator to lag behind fast-moving markets.
The Exponential Moving Average (EMA) was designed to solve this limitation. It assigns greater weight to recent prices, making it more responsive to current market conditions. Because of this sensitivity, EMAs are often preferred by short-term traders and those trading volatile instruments.
Almost all modern charting platforms—such as MetaTrader, TradingView, and cTrader—include both SMA and EMA as standard indicators.
How Do You Calculate a Moving Average?
Calculating the Simple Moving Average (SMA)
The SMA is calculated by adding together the closing prices over a selected period and dividing by the total number of periods.
SMA Formula:
SMA = (Sum of closing prices) ÷ Number of periods
![]()
Where:
- A = Each price data point
- n = Number of time periods
SMA Calculation Example (EUR/USD)
Assume we are analyzing a 5-day SMA on a daily EUR/USD chart with the following closing prices:
- Day 1: 1.321
- Day 2: 1.301
- Day 3: 1.325
- Day 4: 1.327
- Day 5: 1.326
SMA Calculation:
(1.321 + 1.301 + 1.325 + 1.327 + 1.326) ÷ 5 = 1.32
This value represents the average closing price over the last five days.
Calculating the Exponential Moving Average (EMA)
The EMA places more emphasis on recent prices, making it more sensitive to trend changes.
EMA Formula:
EMA = (Current Price − Previous EMA) × Smoothing Factor + Previous EMA
![]()
Where:
- EMAt = EMA today
- Vt = Price today
- d = Number of periods
- Smoothing factor = 2 ÷ (d + 1)
Steps to Calculate EMA:
- Calculate the SMA for the selected period
- Calculate the smoothing multiplier using:
2 ÷ (period + 1)
- Apply the EMA formula using the previous EMA value
For example, a 10-day EMA uses a smoothing factor of:
2 ÷ (10 + 1) = 0.1818
Below is a simplified illustration of how a 10-day EMA evolves over time as new price data becomes available.
|
Date |
Price |
10-day SMA |
Smoothing Constant 2/(10 + 1) |
10-day EMA |
|
|
1 |
24-Apr-18 |
23.24 |
|
|
|
|
2 |
25-Apr-18 |
22.99 |
|
|
|
|
3 |
26-Apr-18 |
22.85 |
|
|
|
|
4 |
27-Apr-18 |
23.00 |
|
|
|
|
5 |
28-Apr-18 |
22.96 |
|
|
|
|
6 |
29-Apr-18 |
22.21 |
|
|
|
|
7 |
30-Apr-18 |
21.99 |
|
|
|
|
8 |
1-May-18 |
22.43 |
|
|
|
|
9 |
2-May-18 |
22.24 |
|
|
|
|
10 |
3-May-18 |
22.55 |
22.65 |
|
22.65 |
|
11 |
4-May-18 |
22.15 |
22.54 |
0.1818 |
22.56 |
|
12 |
5-May-18 |
22.39 |
22.48 |
0.1818 |
22.53 |
|
13 |
6-May-18 |
22.38 |
22.43 |
0.1818 |
22.50 |
|
14 |
7-May-18 |
22.61 |
22.39 |
0.1818 |
22.52 |
|
15 |
8-May-18 |
23.36 |
22.43 |
0.1818 |
22.67 |
|
16 |
9-May-18 |
24.05 |
22.62 |
0.1818 |
22.92 |
|
17 |
10-May-18 |
23.75 |
22.79 |
0.1818 |
23.07 |
|
18 |
11-May-18 |
23.83 |
22.93 |
0.1818 |
23.21 |
|
19 |
12-May-18 |
23.95 |
23.10 |
0.1818 |
23.35 |
|
20 |
13-May-18 |
23.63 |
23.21 |
0.1818 |
23.40 |
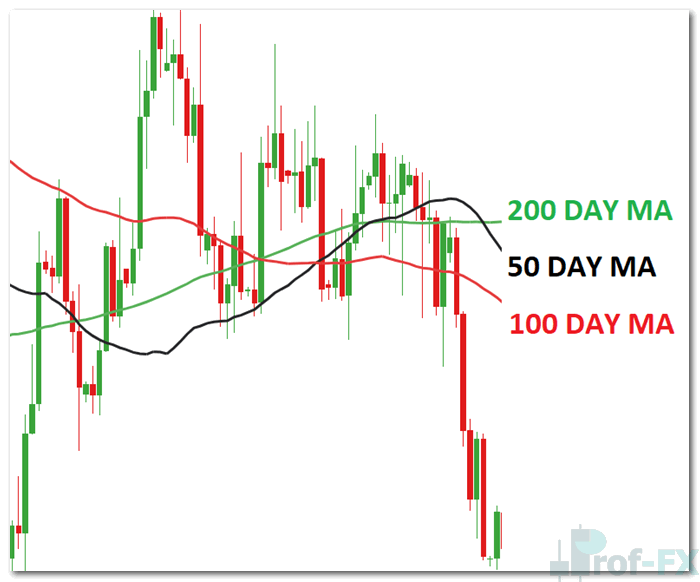
What Is the Purpose of Moving Averages?
The primary purpose of moving averages is to filter out market noise and highlight the underlying trend. Instead of reacting to short-term volatility, traders can focus on the overall direction of price movement.
Key benefits of moving averages include:
- Identifying market trends
- Helping define entry and exit points
- Acting as dynamic support and resistance levels
- Being fully customizable across timeframes and strategies
When price trades above a moving average, the MA often acts as support. When price trades below, it frequently acts as resistance.
How Do Traders Interpret Moving Averages?
Professional traders typically use moving averages in three main ways.
1. Using Moving Averages to Identify Trend Direction
When price consistently trades above a rising moving average, it signals a bullish trend. Traders generally look for buying opportunities in this environment.
Conversely, when price remains below a declining moving average, it suggests a bearish trend, where selling opportunities may be preferred.
This simple observation alone can help traders avoid trading against the dominant market direction.
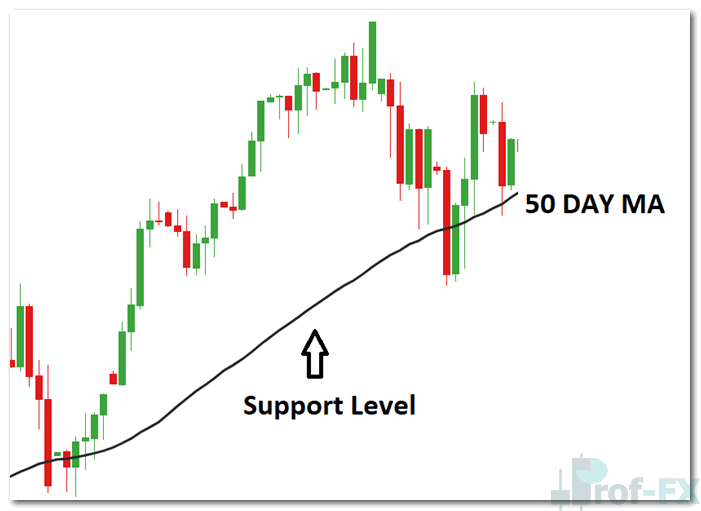
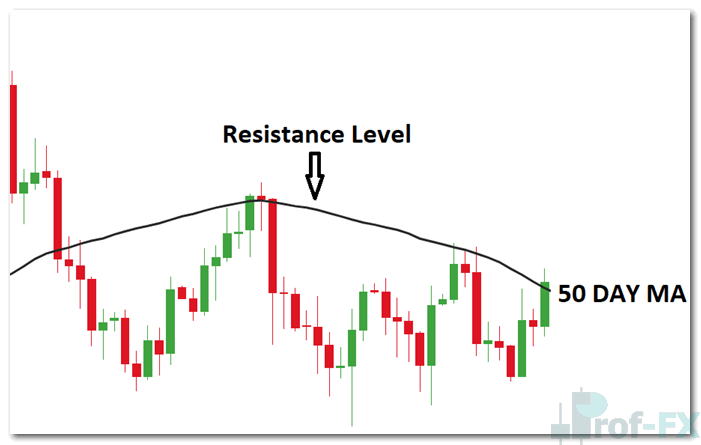
2. Moving Averages as Support and Resistance
Moving averages often function as dynamic support and resistance levels.
In an uptrend, traders may enter long positions when price pulls back toward the moving average. The MA can also be used as a stop-loss reference, helping traders manage risk while staying aligned with the trend.
The same logic applies in downtrends, where the moving average may cap price rallies and act as resistance.
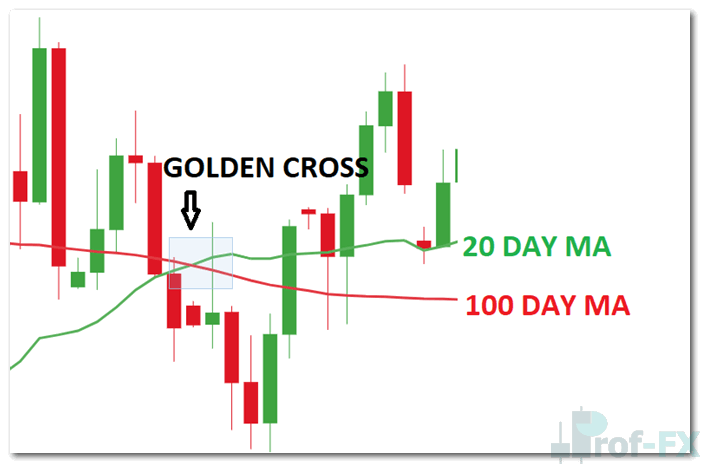
3. Using Multiple Moving Averages (Golden Cross & Death Cross)
Many traders apply multiple moving averages on a single chart to analyze both short-term and long-term trends simultaneously. This approach is particularly effective in trending markets and shares similarities with indicators such as the MACD.
A well-known application involves watching for moving average crossovers:
- Golden Cross: A bullish signal where a short-term MA (e.g., 50-day) crosses above a long-term MA (e.g., 200-day)
- Death Cross: A bearish signal where a short-term MA crosses below a long-term MA
Long-position traders often view a Death Cross as a warning sign, while short-position traders may see a Golden Cross as a signal to reassess bearish exposure.
Moving Average Indicator: Key Takeaways for Traders
The Moving Average is a foundational technical indicator that helps traders identify trends, momentum, and potential support and resistance levels. By using one or multiple moving averages, traders gain a clearer, more structured view of market behavior.
While moving averages are powerful, they are most effective when combined with proper risk management, price action analysis, and a well-defined trading plan.
Become a Better Trader with Professional Trading Insights
To deepen your understanding of moving averages and other technical indicators:
- Learn how to combine MAs with additional indicators
- Study proven habits from the Traits of Successful Traders
- Build consistency by creating a structured trading plan
Prof FX delivers forex news, technical analysis, and educational resources focused on the forces shaping global currency markets—helping traders improve both technical skills and market understanding.


