
Japanese candlestick analysis remains one of the most widely used technical tools in forex trading, and among its many formations, the Shooting Star candlestick pattern stands out as a powerful signal of potential trend reversal. When understood and applied correctly, this pattern can help traders identify bearish turning points with relatively clear risk parameters.
In this guide, we will explore the shooting star candlestick pattern in depth, explain how it forms, outline its advantages and limitations, and demonstrate how forex traders can incorporate it into a structured trading plan.
Understanding the Shooting Star Candlestick Pattern
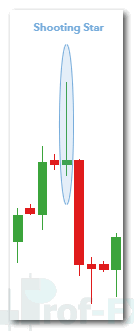
A shooting star candlestick is a bearish reversal pattern consisting of a single candle. It forms when price initially rallies strongly but then faces aggressive selling pressure, forcing it to close near the low of the session.
Visually, the candle is characterized by:
- A small real body near the bottom of the candle
- A long upper wick, typically at least 50% of the candle’s total range
- Little to no lower wick
This structure reflects a clear shift in market sentiment: buyers attempted to push prices higher, but sellers decisively rejected those higher levels.
From a price action perspective, the shooting star communicates failed bullish momentum, making it particularly relevant after an uptrend, a rally into resistance, or an extended pullback within a broader downtrend.
Shooting Star vs. Inverted Hammer: Key Differences
Traders often confuse the shooting star with the Inverted Hammer due to their similar shape. While they look almost identical, their market context is what separates them:
- Shooting Star
- Appears near the top of an uptrend
- Signals a potential bearish reversal
- Appears near the top of an uptrend
- Inverted Hammer
- Appears near the bottom of a downtrend
- Signals a potential bullish reversal
- Appears near the bottom of a downtrend
The candlestick itself does not change—only its location within the trend structure determines its interpretation.
Importantly, this pattern behaves the same way across forex, stocks, indices, and commodities. A shooting star on EUR/USD carries the same technical implications as one on gold or equities.
Why Forex Traders Use the Shooting Star Pattern
The shooting star is especially appealing to newer traders because it is simple to identify and clearly reflects market psychology.
However, professional traders understand that no single candlestick is sufficient on its own. The shooting star becomes significantly more reliable when aligned with other technical elements such as:
- Horizontal resistance levels
- Trend lines
- Prior swing highs
- Overbought oscillators
- Broader market structure
This combination transforms the candle from a visual signal into a high-probability trade setup.
Advantages of the Shooting Star Pattern
- Easy to recognize visually
- Clear bearish narrative
- Works across all timeframes
- Useful for defining precise risk levels
Limitations to Be Aware Of
- Not every shooting star leads to a reversal
- Requires confirmation from structure or indicators
- Less effective in choppy, range-bound markets
Risk management is essential when trading this pattern, as false signals do occur—especially in strong trending environments.
How to Trade the Shooting Star Candlestick Pattern
Let’s walk through a structured approach using a EUR/USD shooting star example.
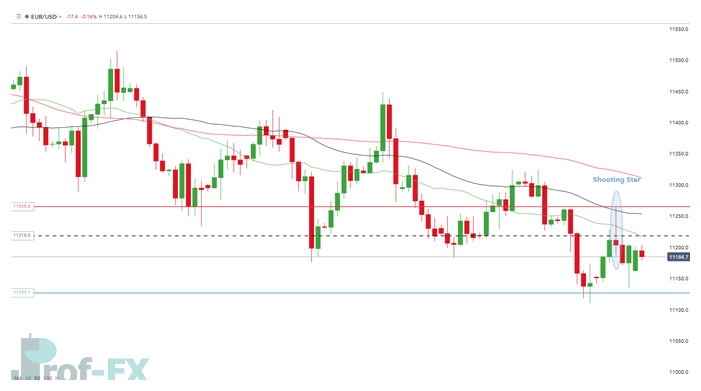
Step 1: Identify the Context
The shooting star should form:
- After a price advance
- Near a resistance zone or trendline
- Following bullish momentum
This context increases the probability that the candle represents distribution rather than noise.
Step 2: Entry Techniques
Since the implication is for lower prices, traders look for short entries. There are two common execution approaches:
1. Aggressive Entry
- Enter short at the open of the next candle
2. Conservative Entry (Wick Retest)
- Wait for price to retrace into the upper portion of the shooting star wick
- This often occurs when the wick is unusually long
Waiting for a retest allows traders to:
- Enter at a better price
- Reduce stop-loss distance
- Improve risk-to-reward ratios
Both approaches are valid, provided they are applied consistently.
Step 3: Stop-Loss Placement
The logical stop-loss location is:
- Above the high of the shooting star candle
This level represents the point where the bearish thesis becomes invalid.
Step 4: Profit Targets and Risk-to-Reward
Prof FX methodology emphasizes asymmetric risk. A common guideline is:
- Minimum 1:2 risk-to-reward ratio
For example:
- 90-pip stop loss
- Target at least 180 pips
This approach aligns with institutional trading principles and the findings from the Forex Education research, which highlights the importance of favorable reward relative to risk.
Key Takeaways for Forex Traders
- The shooting star is a bearish reversal signal, not a standalone strategy
- Best used near resistance or extended price moves
- Requires confirmation and disciplined risk management
- Provides clear structure for entries, stops, and targets
When used within a broader technical framework, the shooting star candlestick can become a valuable component of a consistent trading approach.
Further Reading on Candlestick Trading
- Explore our guide to the Top 10 Candlestick Patterns used by forex traders
- Strengthen your foundation with our forex candlestick education series
- Learn how candlestick analysis fits into broader price action trading
Prof FX provides forex news and technical analysis on the trends that influence the global currency markets.


