
The Bearish Harami is a well-known candlestick reversal pattern that often appears near the top of an uptrend, signaling a potential shift from bullish to bearish momentum. While the pattern itself is relatively easy to spot, professional traders do not rely on it alone. Instead, they use the Bearish Harami alongside price action, trend analysis, and supporting technical indicators to confirm bearish intent.
In this article, I will explain the Bearish Harami pattern in a clear, educational manner—presenting it as I would to beginner forex traders who are learning how to read market behavior rather than simply memorizing patterns.
This guide covers:
- What the Bearish Harami pattern is
- How to identify the Bearish Harami on trading charts
- How to trade the Bearish Harami using confirmation and risk management
- How reliable the Bearish Harami pattern is in real market conditions
What Is a Bearish Harami Pattern?
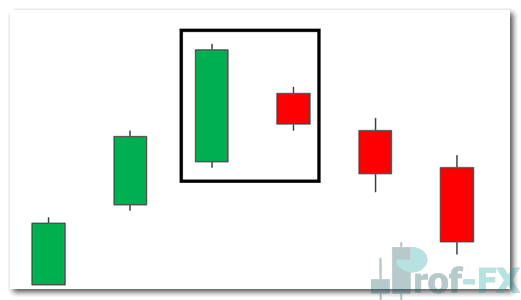
The Bearish Harami is a two-candlestick reversal pattern that forms at the top of an uptrend. It reflects a slowdown in bullish momentum and the early emergence of selling pressure.
The pattern consists of:
- A large bullish candle, representing strong buying pressure
- Followed by a small bearish candle, whose body is fully contained within the body of the prior bullish candle
This sudden contraction in price movement signals indecision and weakening buyer strength. The bearish candle typically opens near the mid-range of the previous bullish candle, highlighting the shift in sentiment.
Structure of the Bearish Harami pattern:
The Bearish Harami is the opposite of the Bullish Harami, which forms at the bottom of a downtrend and signals potential bullish reversals.
How to Identify a Bearish Harami on Trading Charts
Correct identification of the Bearish Harami requires more than recognizing two candles. Traders must assess trend context, momentum, and candle proportions.
A valid Bearish Harami generally appears when:
- The market is in a clear uptrend
- There are signs that bullish momentum is slowing or stalling
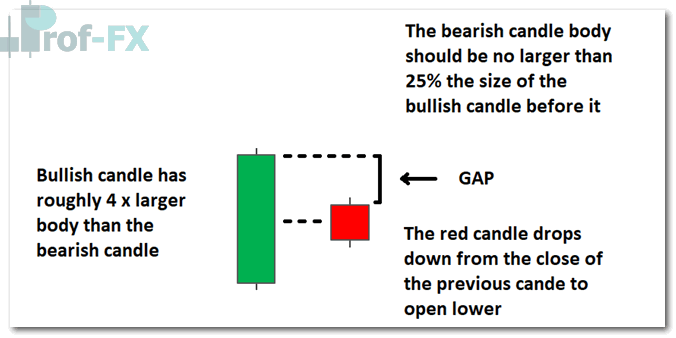
- The bearish candle’s body measures no more than 25% of the previous bullish candle’s body
- The entire bearish candle body is fully contained within the bullish candle’s body
In stock markets, the second candle often gaps down, opening significantly lower than the first candle’s close. In forex, however, gaps are rare due to the market’s 24-hour forex, so the bearish candle usually opens at or very near the previous candle’s close.
This distinction is important and often misunderstood by new traders.
Bearish Harami Formation in the Forex Market
Because the forex market operates 24 hours a day, five days a week, most candles open close to where the previous candle closed. As a result, the Bearish Harami in forex typically looks more compressed than in equities.
Typical Bearish Harami formation in forex:
Here, the small bearish candle opens near the prior close and remains fully contained within the bullish candle’s body. The message remains the same: buyers are losing control.
Bearish Harami Formation in the Stock Market
Stocks trade during fixed market hours, which makes them more susceptible to opening gaps. These gaps can be driven by:
- Negative corporate news released after market close
- Economic data that misses expectations
- Regulatory changes affecting future earnings
- Broad negative market sentiment
As a result, the Bearish Harami in stocks often appears with a noticeable gap down, making the pattern visually more pronounced.
Bearish Harami example on a stock chart (Lloyds Banking Group PLC – FTSE 100):
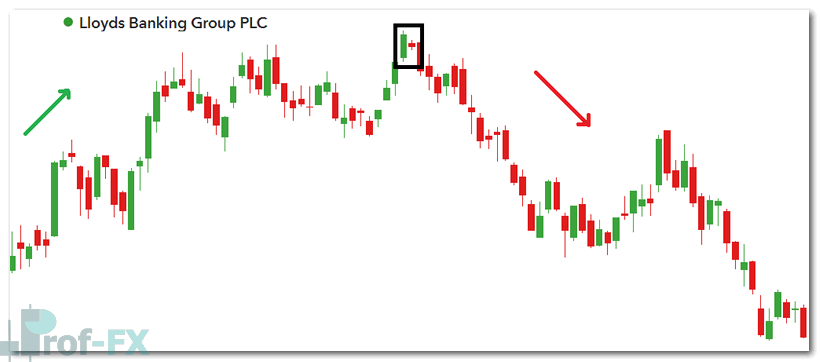
These gaps are common in equities but far less frequent in forex trading.
How to Trade the Bearish Harami Candlestick Pattern
To trade the Bearish Harami effectively, traders should follow a structured confirmation process, rather than acting immediately on the pattern’s appearance.
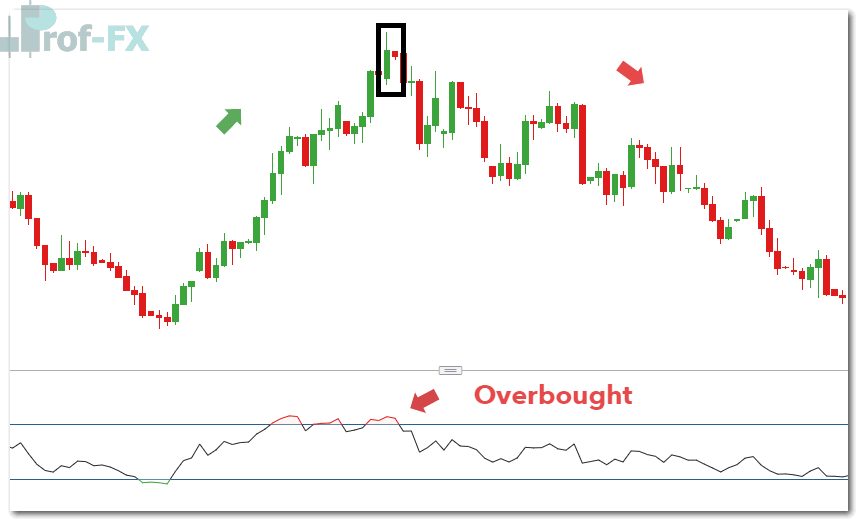
In the USD/SGD example below, the Bearish Harami appears after a sustained uptrend:
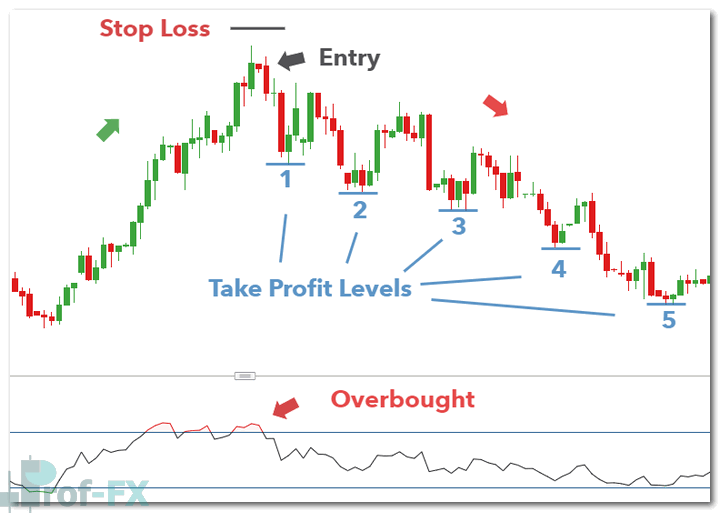
First, the broader uptrend is clearly established through price action, showing higher highs and higher lows.
Second, the RSI (Relative Strength Index) signals overbought conditions, suggesting bullish momentum may be fading. Many traders wait for RSI to cross back below the 70 level to confirm weakening momentum.
Third, the bearish candle is significantly smaller than the bullish candle and remains fully enclosed within it, validating the Harami structure.
Finally, subsequent price action confirms the shift as the market begins to make lower highs, reinforcing bearish intent.
Risk Management and Trade Execution
Professional traders typically:
- Enter short positions at the open of the candle following the completed Bearish Harami
- Place stop-loss orders above the recent high, where bullish momentum last failed
- Use multiple take-profit targets to capture extended downside moves if a new downtrend develops
This approach allows traders to manage risk effectively while participating in potential trend reversals.
How Reliable Is the Bearish Harami Pattern?
The Bearish Harami is a warning signal, not a guarantee. Its reliability depends heavily on:
- Where it forms within the trend
- Nearby resistance levels
- Supporting indicators such as RSI or Stochastics
- Confirmation from subsequent price action
Trading the pattern without confirmation—especially against a strong trend—can lead to false signals. Professional traders improve reliability by stacking multiple forms of confluence.
Advantages and Limitations of the Bearish Harami
Like all candlestick patterns, the Bearish Harami has both strengths and weaknesses.
Advantages
The pattern often appears near the start of a potential downtrend, offering early entry opportunities. It can provide attractive risk-to-reward ratios, sometimes even more favorable than bearish engulfing patterns. Its structure is also easy to recognize, making it accessible to novice traders.
Disvantages
The Bearish Harami should never be traded on formation alone. Its effectiveness depends on appearing at the top of an uptrend and being supported by technical analysis. Traders must understand indicators such as RSI or Stochastics and broader market structure to use it correctly.
Further Reading on Candlestick Patterns
Candlestick patterns play a crucial role in forex technical analysis. To strengthen your foundation, it is recommended to explore:
- How to read a candlestick chart
- Forex education for beginners
- Multi-candle formations and pattern recognition exercises
Multiple candlesticks combine to form recognizable market structures, and mastering these patterns helps traders better understand market psychology, not just price movement.
Prof FX delivers forex news, technical analysis, and educational content focused on the trends and forces shaping the global currency markets.


