
Understanding market volatility is a critical skill for every forex trader, especially beginners. One of the most effective tools for analyzing volatility is the Bollinger Bandwidth indicator. When applied correctly—and combined with price action and supporting technical tools—this indicator can help traders anticipate breakouts, identify potential trend reversals, and improve overall trade timing.
Before going deeper, it is strongly recommended that traders first understand the fundamentals of the Bollinger Band® indicator, as Bollinger Bandwidth is derived directly from it.
In this article, I will explain:
- What the Bollinger Bandwidth strategy is
- How the Bollinger Bandwidth indicator works
- How to calculate Bollinger Bandwidth
- Practical ways to apply the Bollinger Bandwidth strategy
- The advantages and limitations of using this approach
The explanation is presented as if I were guiding new traders step-by-step through the logic behind the indicator and its professional use.
What Is the Bollinger Bandwidth Strategy?
The Bollinger Bandwidth strategy is a volatility-based trading approach that uses the Bollinger Bandwidth indicator to measure the percentage difference between the upper and lower Bollinger Bands® relative to price.
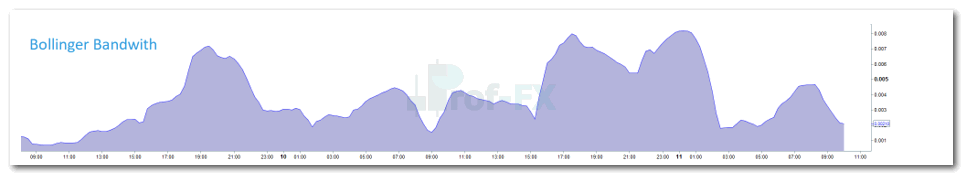
Unlike the standard Bollinger Bands®, which are plotted directly on the price chart, the Bollinger Bandwidth indicator is typically displayed below the main chart in an oscillator-style format. Its primary purpose is not to predict direction, but to measure how compressed or expanded volatility is at any given time.
This makes the indicator particularly useful for:
- Identifying low-volatility consolidation phases
- Spotting high-volatility extremes that may precede reversals
- Preparing for large directional price movements
Bollinger Bandwidth indicator layout:
How Does the Bollinger Bandwidth Indicator Work?
The Bollinger Bandwidth indicator visually represents changes in market volatility over time. When the distance between the upper and lower Bollinger Bands® narrows, the indicator value falls, signaling low volatility. When the bands expand, the indicator rises, signaling high volatility.
From a professional trading perspective:
- Contracting Bandwidth (low volatility) often signals market consolidation
- Expanding Bandwidth (high volatility) reflects increased market activity
After prolonged periods of low volatility, the forex market often experiences strong directional moves, either upward or downward. Conversely, when volatility reaches unusually high levels, this can sometimes indicate trend exhaustion and an increased probability of a reversal.
The chart below demonstrates how price behavior changes as Bollinger Bandwidth expands and contracts.
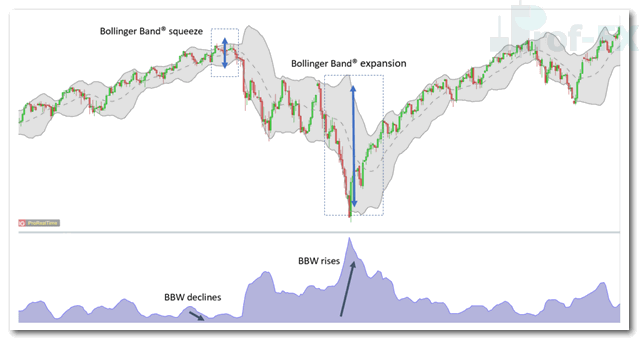
Understanding this volatility cycle is essential, especially for traders who want to avoid entering the market too early or chasing price at emotional extremes.
How to Calculate Bollinger Bandwidth
The Bollinger Bandwidth calculation is straightforward and is usually automated on most trading platforms.
The formula is:
Bandwidth = (Upper Bollinger Band® – Lower Bollinger Band®) / Middle Bollinger Band®
The middle band represents the simple moving average (SMA), typically the 20-period SMA. By expressing the width as a percentage relative to the middle band, traders gain a normalized view of volatility across different currency pairs and timeframes.
How to Apply the Bollinger Bandwidth Strategy: Practical Tips
There are several ways to apply Bollinger Bandwidth in live trading. However, from a professional standpoint, the two most commonly used methods are:
- Low-volatility breakout setups
- High-volatility reversal setups
Let’s examine each approach in a practical trading context.
Bollinger Bandwidth Low-Volatility Breakout Strategy
Periods of low Bollinger Bandwidth readings indicate that the market is consolidating and volatility is suppressed. On the chart, this appears as the Bollinger Bands® tightening closely around price.
In the example below, the daily EUR/USD chart shows a prolonged sideways movement, confirmed by compressed Bollinger Bands® and low Bandwidth readings.
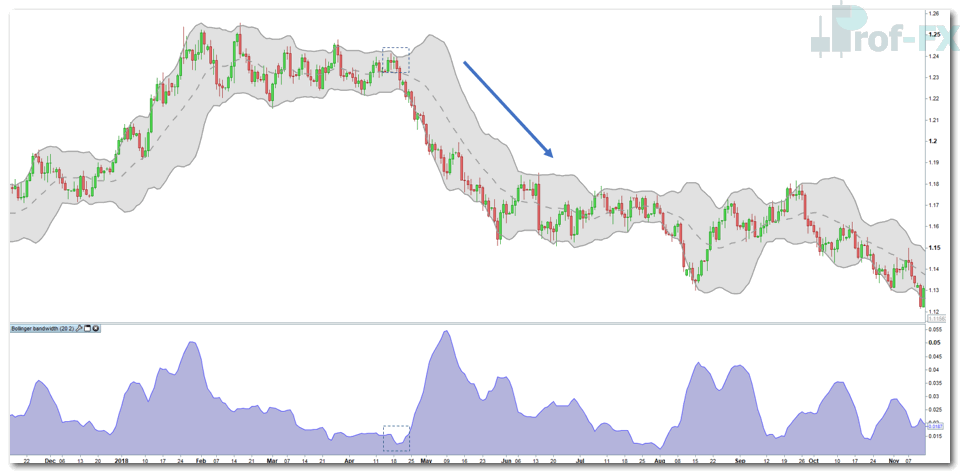
Professional traders interpret this condition as a volatility buildup phase. While the indicator does not indicate direction, it warns that a sharp move is likely to follow.
Because Bollinger Bandwidth does not provide entry or exit signals on its own, traders typically combine it with:
- Price action breakouts
- Bollinger Band® expansions
- Support and resistance levels
- Trendline breaks
This multi-layered approach helps reduce false breakouts and improves trade confidence.
Bollinger Bandwidth Reversal Strategy
High Bollinger Bandwidth readings reflect elevated volatility, which often occurs during strong directional trends or parabolic price movements. While high volatility can support trend continuation, it can also signal trend exhaustion when combined with other warning signs.
In the example below, the USD/JPY daily chart shows expanding Bollinger Bandwidth as price accelerates downward to new lows.
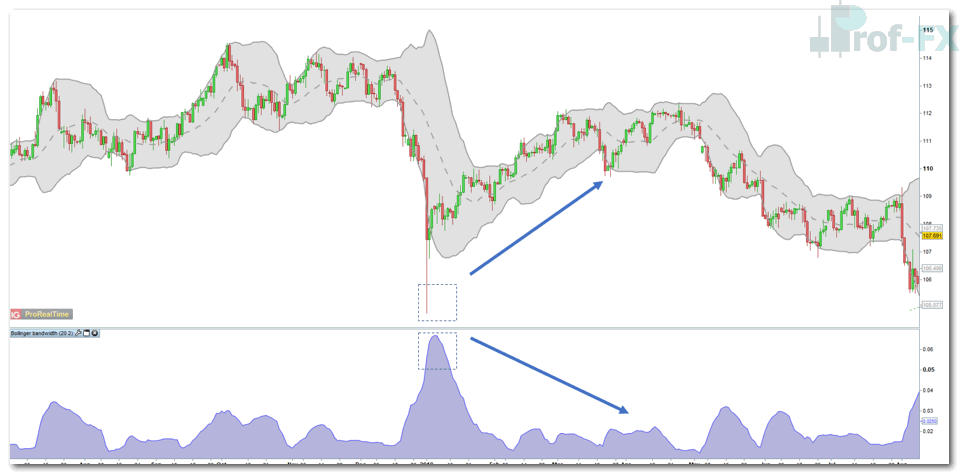
The rapid price extension, combined with rising volatility, suggests increased emotional participation in the market. Additional confirmation appears in the form of a long wick candlestick, which signals rejection of lower prices by buyers.
Professional traders often use complementary tools such as:
- Fibonacci retracement levels
- Price action trendlines
- Horizontal support and resistance zones
These tools help define precise entry and exit levels, which the Bollinger Bandwidth indicator alone does not provide.
Advantages and Limitations of the Bollinger Bandwidth Strategy
Like all trading tools, Bollinger Bandwidth has strengths and weaknesses that traders must understand.
Advantages
- Easy to access and visually interpret
- Effectively highlights volatility expansion and contraction
- Helps identify high risk-reward trade opportunities
- Works across multiple timeframes and currency pairs
Limitations
- Does not provide direct entry or exit levels
- Requires confirmation from price action or other indicators
- Can be confusing for novice traders if used without context
- Must be interpreted differently depending on market conditions
Further Learning on Bollinger Bands®
Bollinger Bands® remain one of the most versatile tools in technical analysis, especially for volatility-based trading strategies. To deepen your understanding, traders are encouraged to explore:
- How Bollinger Bands® reflect market volatility
- Day trading and scalping techniques using Bollinger Bands®
- Combining Bollinger Bands® with indicators such as MACD
Mastering Bollinger Bandwidth is not about predicting direction – it is about preparing for opportunity. When combined with disciplined analysis and proper risk management, it can become a valuable component of a trader’s long-term forex strategy.


