


Skip to content
Prof FX
  • Home
  • Market
    • Analysis & Outlook
    • News
  • Central Banks
    • Federal Reserve
    • European Central Bank
    • Bank of England
    • Bank of Canada
    • Bank of Japan
    • Reserve Bank of Australia
    • Reserve Bank of New Zealand
    • Swiss National Bank
  • Education
    • Forex Basics
    • Technical
    • Fundamental
    • Forex Advanced
    • Risk Management
    • Trading Psychology
    • Economic
    • Investing
  • Forex Courses
  • Resources
    • MT4 Indicator
    • MT5 Indicator
    • Ebook
  • Brokerage
    • All Forex Brokers
    • Broker News
    • Regulation Authorities
    • Broker Programs
  • Tools
  • English
    • English
    • Bahasa Indonesia
    • Bahasa Melayu
MENU
  • Index
  • Deposit Bonuses
  • No Deposit
  • Demo Contest
  • Live Contest
Forex Advertising Header - headway
Forex Advertising rectangle - headway
Forex Advertising Footer - headway
NZD - RBNZ Press Conference
Forecast: - | Previous: -
Collecting data.
Wait until next event.
00 Days
00 Hours
00 Minutes
00 Seconds
Trade Now!

Tag: Candlestick

Definition – What does Candlestick Chart mean?

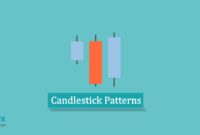
A candlestick chart is a chart that tracks the price range of a currency pair using a combination line and bar chart. A candlestick chart records the open, high, low and close for each specified time period. The chart is made up of figures that are referred to as candlesticks. The line, called the shadow, records the range, while the thicker bar records the open and close. If the close is below the open, the candlestick body is filled in (black). If the close is above the open, the body is not filled (white).

Prof FX explains Candlestick Chart

Candlesticks are very useful for visualizing patterns in price action hour to hour, day to day and so on. Candlestick charts are used by traders for simple trend identification as well as more complex price patterns. For example, a succession of white candles indicates consistently higher closes, meaning an uptrend.

Candlestick charts were originally a Japanese form of charting used for trading rice futures, but have proved to be very useful for forex trading as well.
Candlestick Pin Bar

The Pin and Drive Reversal Entry Trigger

By Ameer LuqmanPosted on August 20March 6

As you might know, I’m mainly a reversal trader. I use other strategies as well, but my bread and butter setups revolve …

Forex Candlestick Patterns

Candlestick Patterns Basics for Beginner Trader

By Victor ChenPosted on July 16March 6

In candlestick patterns basics, we’re going to start right at the beginning with how to interpret candles. Each candle represents …

  • Prev
  • 1
  • 2
  • 3
Forex Advertising Package

Risk Disclaimer:
Prof FX is an independent media platform and does not provide investment or financial advice. Trading Forex and other leveraged products involves substantial risk and may result in losses exceeding your initial investment. Past performance is not indicative of future results. Always seek independent professional advice and fully understand the risks before trading. Read Full Disclaimer

  • About Us
  • Advertising
  • Contact Us
  • Disclaimer
  • Risk Disclaimer
  • Terms of Use
  • Privacy Policy

Follow us

  • Facebook
  • Twitter
  • LinkedIn
  • Pinterest
  • Mastodon
  • Flipboard
Prof FX
© 2018-2025 | Make money with your brain in futures market
prof.fx@gmail.com